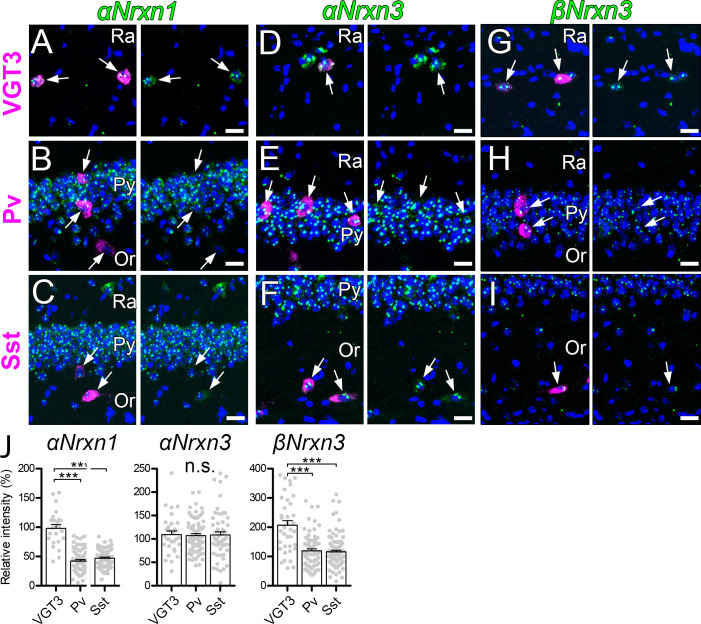
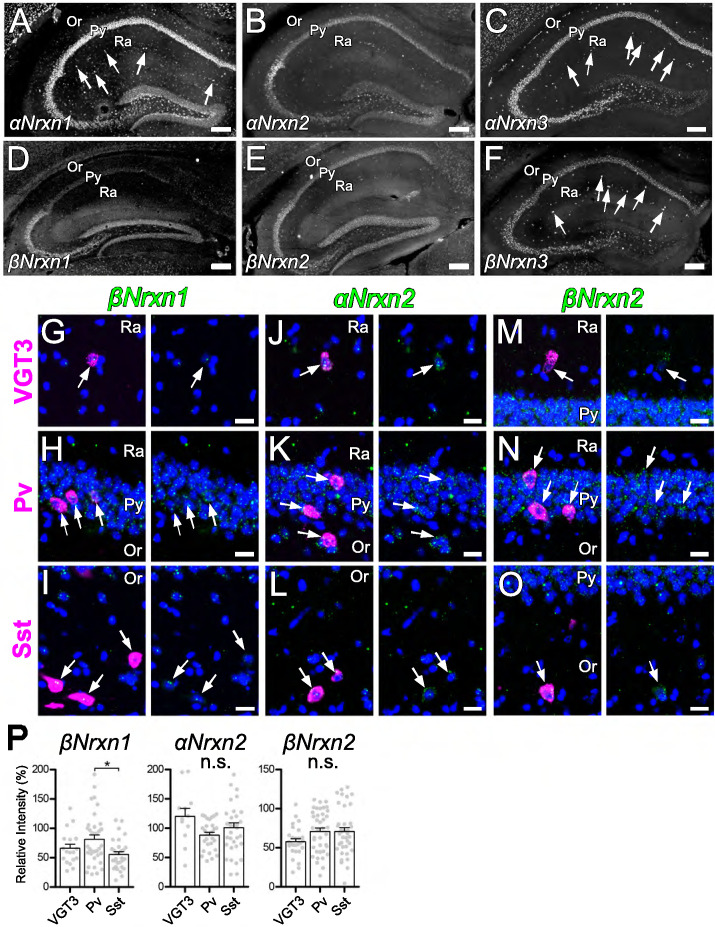
Figure 6. Expression of Nrxn isoforms in different types of inhibitory interneurons in the hippocampal CA1 region.
Double FISH for αNrxn1 (A, B, and C), αNrxn3 (D, E, and F), and βNrxn3 (G, H, and I) mRNAs in VGT3+ (A, D, and G), Pv+ (B, E, and H), and Sst+ (C, F, and I) in the hippocampus showing different levels of Nrxn mRNA (green) expression in different inhibitory interneurons (magenta). Note that the signal intensity in individual GABAergic neurons is variable, compared with that in glutamatergic neurons. Nuclei were stained with DAPI (blue). Or, st. oriens; Py, st. pyramidale; Ra, st. radiatum. (J) Summary scatterplots for αNrxn1, αNrxn3, and βNrxn3 mRNAs in VGT3+, Pv+, and Sst+ inhibitory interneurons. Data are represented as mean ± SEM. ns, not significant; ***p<0.001 (Mann–Whitney U-test). Scale bars, 20 μm.


