. 2020 Dec 14;9:e55730. doi: 10.7554/eLife.55730

Figure 3. CMF mRNAs are detectable in EC nuclei ex vivo and in situ in vivo.

(A) Representative flow cytometry plot of GFP expression from isolated nuclei from Cdh5/NuTRAP mice. About 20% of nuclei are GFP+ (endothelial), with no co-staining with the cardiomyocyte-specific nuclear marker PCM1. Gating scheme for identification of single nuclei shown in Figure 3—figure supplement 1 (B) Relative expression (by qPCR) of nuclear RNA from isolated GFP+ (endothelial) or GFP- (non-endothelial) nuclei. Blue box: stromal genes; red box: CMF genes. (C) Average fold change of expression (GFP+/GFP-) in (B) for fibroblast or CMF genes. (D) Confocal images of heart sections. RNAScope probes for Cdh5 (endothelial) and CMF (Tnnt2) mRNA were co-stained with Pecam1 antibody. Shown are confocal slices of 0.96 μm thickness. Additional images are available Figure 3—figure supplement 2.

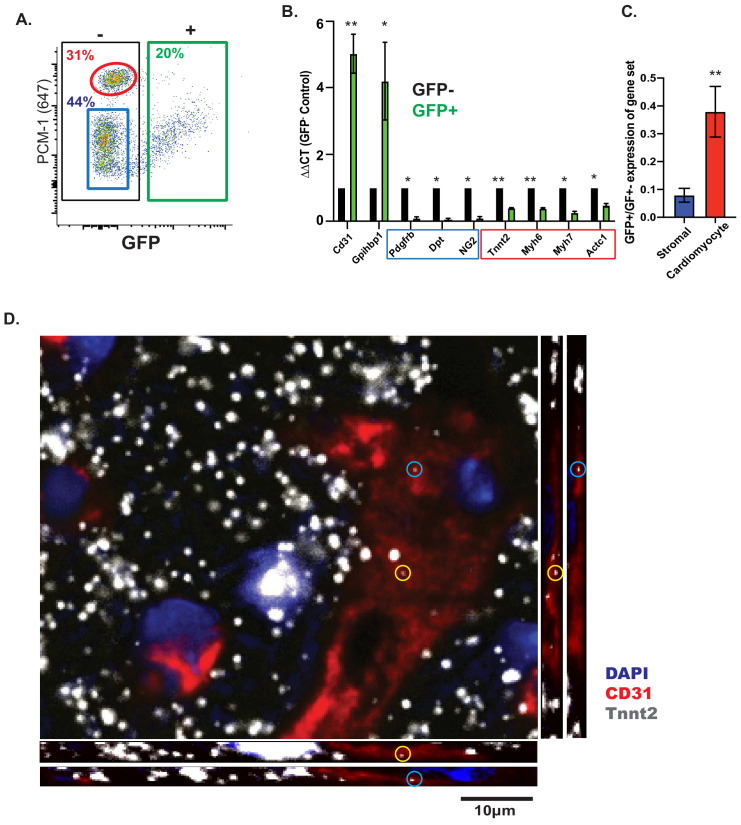
Figure 3.

Figure 3—figure supplement 1. Cdh5-Cre/NuTRAP nuclei sorting scheme.

Figure 3—figure supplement 1.

Nuclei from NuTRAP animals were isolated from whole adult hearts as described in Methods, and isolated by florescence-activated cell sorted (FACS). Gating for single, GFP+ nuclei is shown as left to right. Nuclei were first identified on the basis of DAPI staining to remove debris and 4 n nuclei, and doublets removed by FSC-A/FSC-H gating. FSC-A/SSC-A used to remove any remaining debris, and GFP+ gate used to identify endothelial nuclei.
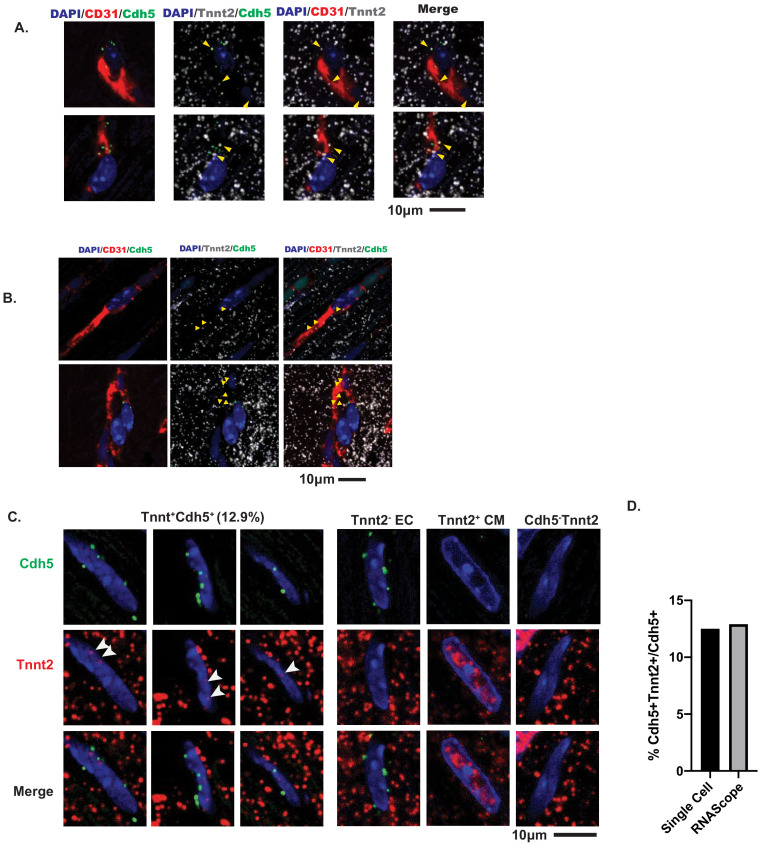
Figure 3—figure supplement 2. Confocal imaging of Tnnt2 mRNA by RNAScope in heart sections.

Figure 3—figure supplement 2.

(A–B) Adult mouse cardiac sections were co-stained for Pecam1 (CD31) protein, as well as Tnnt2 and Cdh5 RNAScope probes. DAPI used as a nuclear counterstain. Shown are 0.96µm-thick slices of a confocal z-stack (A). Co-localization of Cdh5 (green) and Tnnt2 (white mRNA). (B) Cytoplasmic Tnnt2 within a vessel marked by CD31 (red). (C) Nuclear localization of Tnnt2 (red) in endothelial nuclei identified by Cdh5 (green). Right panel shows Tnnt2- endothelial cells and cardiomyocytes (CM) for comparison, as well as Tnnt2-Cdh5- cells. (D) Quantification of percent of Cdh5+ nuclei with Tnnt2. Comparison to Tabula Muris single-cell RNASeq.