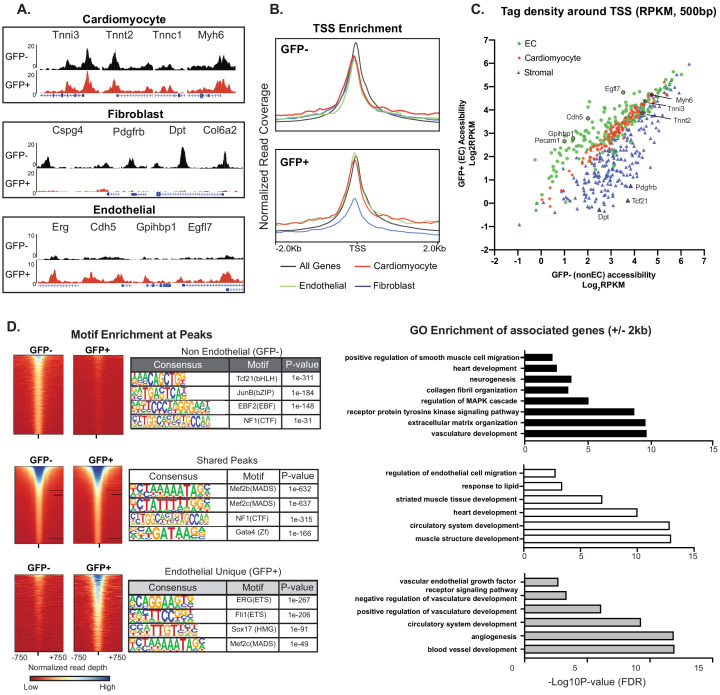
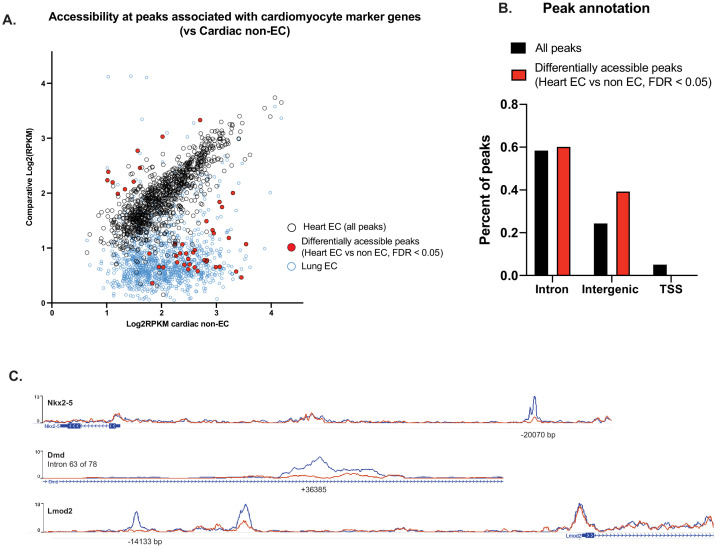
Figure 4. Cardiac ECs maintain open chromatin at CMF genes.
(A) Representative ATACSeq gene tracks for cardiomyocyte, fibroblast, or endothelial cell genes in isolated GFP+ (endothelial, in red) or GFP- (non-endothelial, in black) nuclei. (B) Genome-wide open chromatin at the transcriptional start sites (TSSs) of cardiomyocyte, stromal, or endothelial cell genes in GFP- (non-endothelial) and GFP+ (endothelial) nuclei. Note chromatin of cardiomyocyte genes (red) is as open in ECs (GFP+) as non-ECs (GFP-). (C) Comparison of accessibility in GFP- vs GFP+ nuclei at TSS peaks (+/- 250 bp) for EC genes (green), cardiomyocyte genes (red), and stromal genes (blue). Note again that chromatin of cardiomyocyte genes is as open in EC as non-EC nuclei. (D) Motif enrichment analysis of ATACSeq peaks unique to non-endothelial (GFP-) nuclei (top), unique to endothelial (GFP+) nuclei (bottom), and shared peaks (middle). Right panels: gene ontology (GO) analysis of genes within 2 kb of each peak set. Full statistics and GO annotations for peak regions shown in Supplementary file 3. Additional analyses shown in Figure 4—figure supplement 1.


