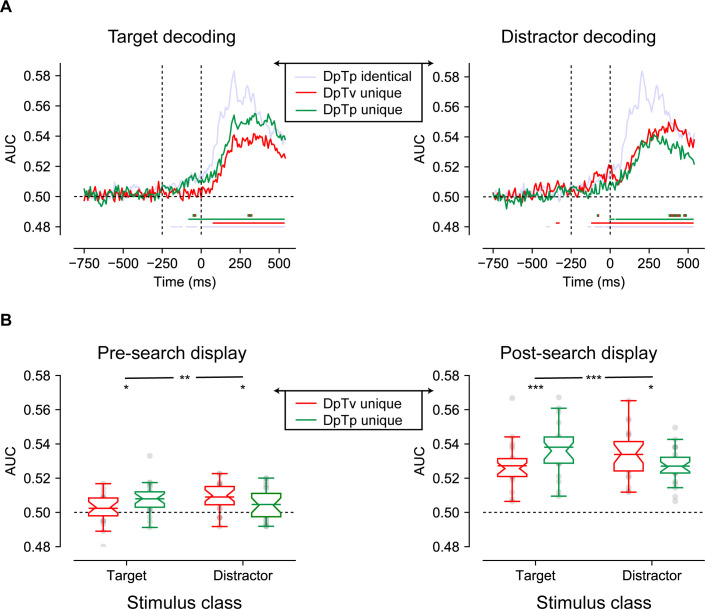
Figure 4. Multivariate decoding of the target and distractor spatial frequency across conditions using broad-band EEG of all 64 electrodes.
(A) AUC scores of target (left) and distractor (right) decoding across time. Colored bars on the x-axis (blue; red; green) indicate clusters where conditions differ significantly from chance after cluster correction (p<0.05). Red and green dashed lines indicate clusters with a significant difference between DpTv unique and DpTp unique conditions after cluster correction (p<0.05). (B) Averaged auc scores during the pre_search display (−250–0 ms; left) and the post-search display (0–550 ms; right) visualized by notched boxplots with solid horizontal lines corresponding to the mean. Horizontal black dashed lines across plots indicates chance performance, whereas the vertical dashed black lines in the upper plots indicate the onset of placeholder (−250 ms) and the search display (0 ms).

