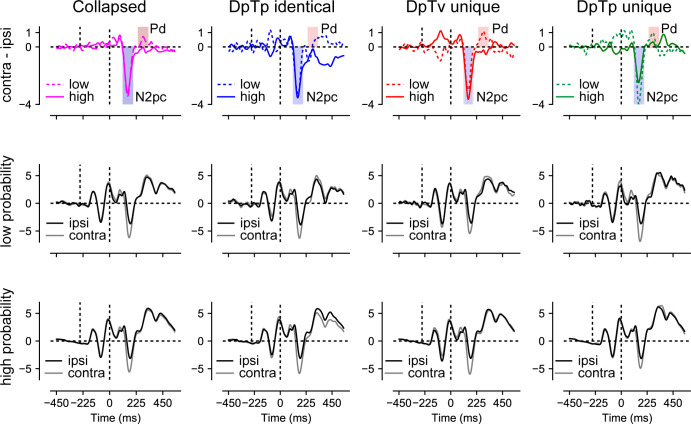
Figure 6. Distractor Pd reduces as a function of distractor location expectations.
ERP results from search trials with lateral distractors collapsed across all conditions (column 1) and separately for each condition (columns 2–4). Row one shows the difference between contra- and ipsilateral waveforms for the low and high-probability distractor location. Only the distractor-evoked Pd, not the N2pc, was reduced at high- vs. low-probability distractor locations (top left figure). Rows 2 and 3 show the contra- and ipsilateral waveforms for the low- and high-probability distractor locations, respectively. Microvolts are plotted on the y-axes. Blue and red transparent rectangles in row one show the mean averaging windows for N2pc and Pd analyses.

