. 2020 Oct 29;9:e62071. doi: 10.7554/eLife.62071

Figure 3. Sleep drives arteriole dilatations larger than those seen in the awake brain.

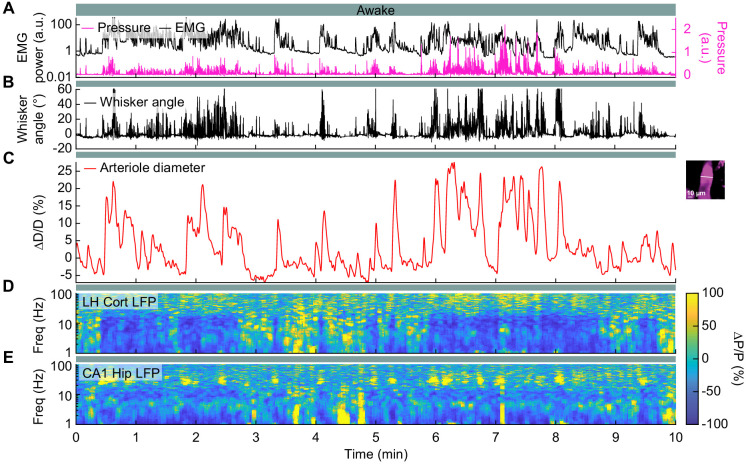
(A) Schematic of two-photon experimental setup. (B) Schematic of thinned-skull window and electrode recording sites. (C) Left: Diagram showing hippocampal CA1 recording site. Right: Diagram of vibrissae cortex recording site. Adapted from Figure (52) (left) and Figure (42) (right) of The Mouse Brain in Stereotactic Coordinates, 3rd Edition (Franklin and Paxinos, 2007). (D) Average response to awake volitional whisking (n = 6 mice, 29 arterioles). Top: Example showing a single arteriole’s diameter during rest and during a brief whisking event. Bottom: average change in arteriole diameter ∆D/D (%) during brief (2–5 s long) whisking events. Shaded regions indicate ±1 standard deviation. (E-I) Example showing the vascular and neural changes accompanying transitions among the NREM, REM and awake states. (E) Nuchal muscle activity through normalized EMG and body motion via a pressure sensor located beneath the mouse. (F) Whisker position. (G) Changes in arteriole diameter ∆D/D (%). (H) Normalized vibrissae cortical LFP. (I) Normalized CA1 LFP power.

Figure 3.

Figure 3—figure supplement 1. | Volitional whisking causes arteriole dilation.

Figure 3—figure supplement 1.

(A) Brief awake whisking events (0.5–2 s) spurred a small dilation 0.8 ± 0.9%. (B) Moderate length awake whisking events (2–5 s) lead to a more robust dilation (8.3 ± 4.9%). (C) Extended awake whisking events (>5 s) produced the largest dilations (10.9 ± 4.3%, n = 29 arterioles).
Figure 3—figure supplement 2. Arteriole dilatations during sleep are larger than those during the awake state.

Figure 3—figure supplement 2.

Example showing the vascular and neural changes accompanying transitions among the NREM, REM, and awake states. Arterial diameters were imaged using two-photon microscopy. (A) Nuchal muscle activity through normalized EMG and body motion via a pressure sensor located beneath the mouse. (B) Whisker position. (C) Changes in arteriole diameter ∆D/D (%) in the putative vibrissa cortex. (D) Normalized LFP power from the left hemisphere stereotrode located in the left vibrissa cortex. (E) Normalized LFP power from the stereotrode in left CA1.
Figure 3—figure supplement 3. Arteriole dilatations during sleep are larger than those during the awake state.

Figure 3—figure supplement 3.

Example showing the vascular and neural changes accompanying transitions among the NREM, REM, and awake states. Arterial diameters were imaged using two-photon microscopy. (A) Nuchal muscle activity through normalized EMG and body motion via a pressure sensor located beneath the mouse. (B) Whisker position. (C) Changes in arteriole diameter ∆D/D (%) in the putative vibrissa cortex. (D) Normalized LFP power from the left hemisphere stereotrode located in the left vibrissa cortex. (E) Normalized LFP power from the stereotrode in left CA1.
Figure 3—figure supplement 4. Arteriole dilatations during sleep are larger than those during the awake state.

Figure 3—figure supplement 4.

Example showing the vascular and neural changes accompanying transitions among the NREM, REM, and awake states. Arterial diameters were imaged using two-photon microscopy. (A) Nuchal muscle activity through normalized EMG and body motion via a pressure sensor located beneath the mouse. (B) Whisker position. (C) Changes in arteriole diameter ∆D/D (%) in the putative vibrissa cortex. (D) Normalized LFP power from the left hemisphere stereotrode located in the left vibrissa cortex. (E) Normalized LFP power from the stereotrode in left CA1.
Figure 3—figure supplement 5. Arteriole dilatations during sleep are larger than those during the awake state.

Figure 3—figure supplement 5.

Example showing the vascular and neural changes accompanying transitions among the NREM, REM and awake states. Arterial diameters were imaged using two-photon microscopy. (A) Nuchal muscle activity through normalized EMG and body motion via a pressure sensor located beneath the mouse. (B) Whisker position. (C) Changes in arteriole diameter ∆D/D (%) in the putative vibrissa cortex. (D) Normalized LFP power from the left hemisphere stereotrode located in the left vibrissa cortex. (E) Normalized LFP power from the stereotrode in left CA1.