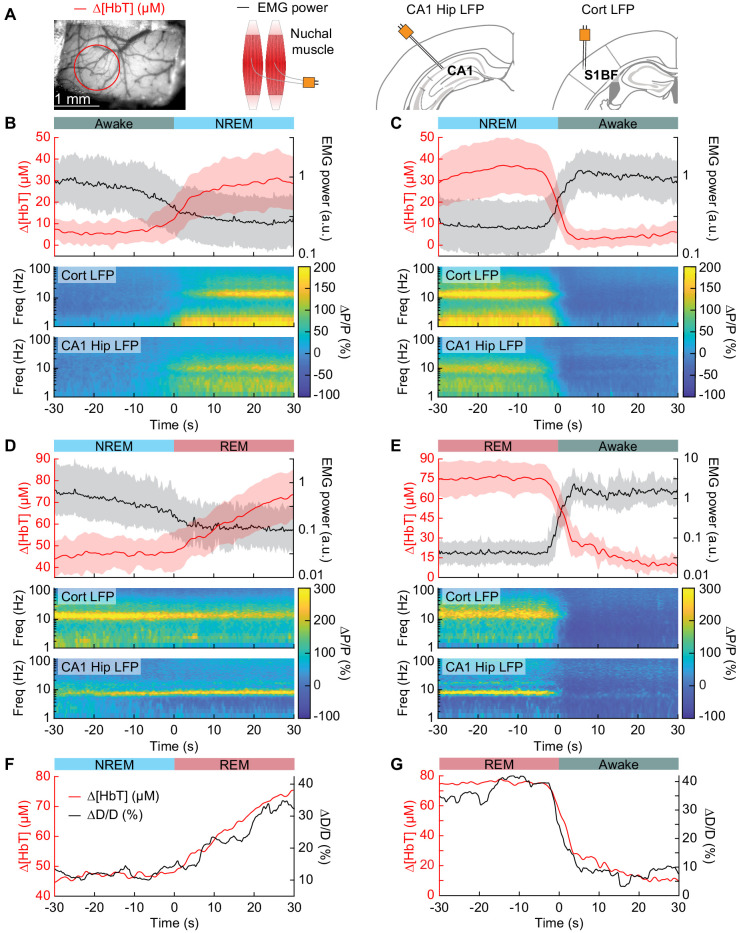
Figure 4. Vasodilation tracks transitions between arousal states.
(A) Schematic of each data type. (B) Transition from periods classified as rfc-Awake into periods classified as rfc-NREM. Top: Average change in total hemoglobin ∆[HbT] within the ROI and normalized change in EMG power. Shaded regions indicate ± 1 standard deviation (n = 14 mice, 28 hemispheres). (C) Transition from periods classified as rfc-NREM into periods classified as rfc-Awake. (D) Transition from periods classified as rfc-NREM into periods classified as rfc-REM. (E) Transitions from periods classified as rfc-REM into periods classified as rfc-Awake. (F) Mean arteriole diameter during the transition of NREM into REM (n = 5 mice, 8 arterioles). (G) Mean arteriole diameter during the transition from REM into Awake (n = 5 mice, 8 arterioles). Note that the EMG scales are different across conditions.


