. 2020 Oct 29;9:e62071. doi: 10.7554/eLife.62071

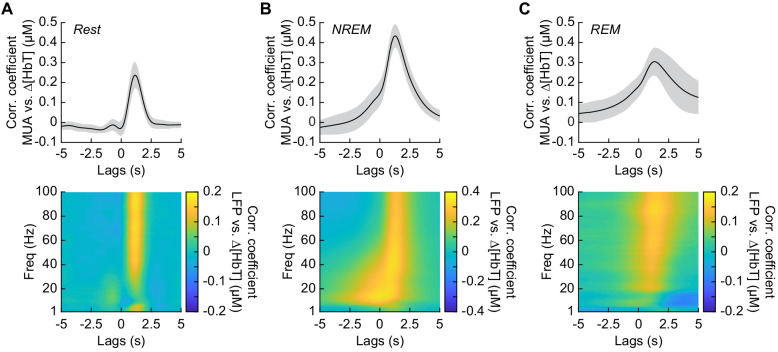
Figure 6. Neurovascular coupling is strongest during NREM sleep.

Cross-correlation between neural activity and changes in total hemoglobin ∆[HbT] during different arousal states, averaged across hemispheres. MUA power [300–3000 Hz] (top) and the LFP [1–100 Hz] (bottom) were consistently correlated with hemodynamics to varying degrees. (A) Awake rest. (B) Contiguous NREM sleep. (C) Contiguous REM sleep. Shaded regions indicate ±1 standard deviation (n = 14 mice, 28 hemispheres).

Figure 6.

Figure 6—figure supplement 1. Neurovascular coupling dynamics change with arousal state.

Figure 6—figure supplement 1.

Cross-correlation between neural activity and changes in total hemoglobin ∆[HbT] during different arousal states, averaged across hemispheres. MUA power [300–3000 Hz] and the LFP gamma band [30–100 Hz] were consistently correlated with hemodynamics to varying degrees, dependent on arousal state. (A) Peak cross-correlation between MUA and ∆[HbT]. (B) Time-to-peak of the cross-correlation between MUA and ∆[HbT]. (C) Peak cross-correlation between gamma band and ∆[HbT]. (D) Time-to-peak of the cross-correlation between gamma band and ∆[HbT]. Error bars indicate ±1 standard deviation (n = 14 mice, 28 hemispheres). *p<0.05, **p<0.01, ***p<0.001 GLME.