. 2020 Oct 29;9:e62071. doi: 10.7554/eLife.62071

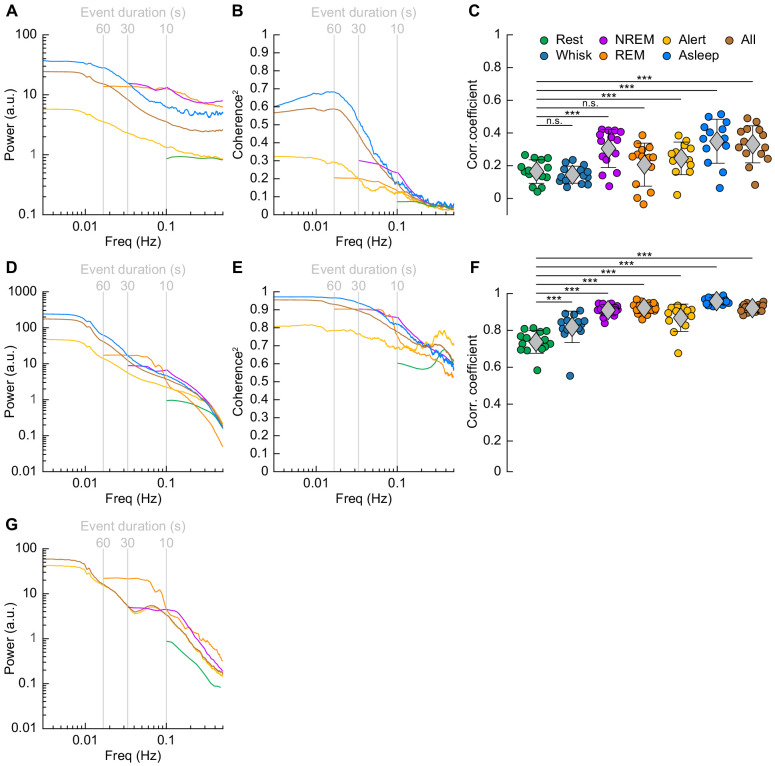
Figure 7. Correlations in neural activity and blood volume between hemispheres increase during sleep.

(A) Mean gamma band power spectral density during different arousal states. (B) Mean coherence (between hemispheres) in the changes in the envelope (≤1 Hz) of gamma band power [30–100 Hz] between left and right vibrissa cortex during different arousal states. (C) Average gamma band power Pearson’s correlation coefficient between left and right vibrissa cortex during different arousal states. Circles represent individual mice and diamonds represent population averages ± 1 standard deviation. (D-F) Same as in A-C except for the changes in total hemoglobin ∆[HbT]. MoC2 between the left and right somatosensory cortex for gamma band power and ∆[HbT] during each arousal state exceeded the 95% confidence level for all frequencies below 1 Hz. (A-F) n = 14 mice (n*two hemispheres in A,D) for all arousal states except Alert: n = 12 mice, Asleep: n = 13 mice. (G) Mean arteriole ∆D/D power spectral density during different arousal states (Rest: n = 6 mice, 29 arterioles, NREM: n = 6 mice, 21 arterioles, REM: n = 5 mice, 10 arterioles, Awake: n = 6 mice, 27 arterioles, All data: n = 6 mice, 29 arterioles). *p<0.05, **p<0.01, ***p<0.001 GLME.

Figure 7.

Figure 7—figure supplement 1. Arousal state dependence of low-frequency neural power and coherence2.

Figure 7—figure supplement 1.

Spectral power and MoC2 at 0.1 or 0.01 Hz during different arousal states. (A–H) n = 14 mice (n*two hemispheres in A,B,E,F) for all arousal states except Alert: n = 12 mice, Asleep: n = 13 mice. (A–D) Gamma band power. (E–H) ∆[HbT]. (I,J) Spectral power at 0.1 or 0.01 Hz during different arousal states for arteriole ∆D/D (Rest: n = 6 mice, 29 arterioles, NREM: n = 6 mice, 21 arterioles, REM: n = 5 mice, 10 arterioles, Awake: n = 6 mice, 27 arterioles, All data: n = 6 mice, 29 arterioles). Circles represent individual hemispheres of each mouse (A–H) or individual arterioles (I,J) and diamonds represent population averages, with error bar showing ±1 standard deviation. Data is presented in Tables 1, 2, 3, 4, 5. *p<0.05, **p<0.01, ***p<0.001 GLME.
Figure 7—figure supplement 2. Correlations in neural activity between hemispheres increase during sleep.

Figure 7—figure supplement 2.

(A) Mean delta band power spectral density during different arousal states. (B) Mean coherence (between hemispheres) in the changes in the envelope (≤1 Hz) of delta band power [1–4 Hz] between left and right vibrissa cortex during different arousal states. (C) Average delta band power Pearson’s correlation coefficient between left and right vibrissa cortex during different arousal states. Circles represent individual mice and diamonds represent population averages ± 1 standard deviation. (D–F) Same as in (A–C) except for the theta band power [4–10 Hz]. (G–I) Same as in (A–C) except for the alpha band power [10–13 Hz]. (J–L) Same as in (A–C) except for the beta band power [13–30 Hz]. MoC2 between the left and right somatosensory cortex for each LFP band during each arousal state exceeded the 95% confidence level for all envelope frequencies below 1 Hz. (A–L) n = 14 mice (n*two hemispheres in A,D,G,J) for all arousal states except Alert: n = 12 mice, Asleep: n = 13 mice. Data is presented in Supplementary file 1. *p<0.05, **p<0.01, ***p<0.001 GLME.
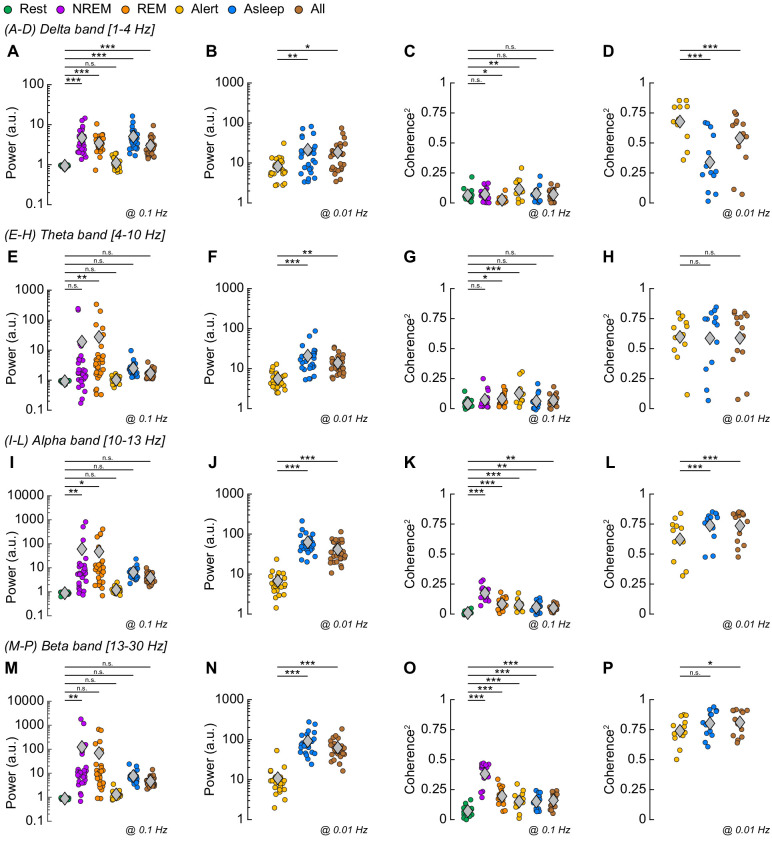
Figure 7—figure supplement 3. Arousal state dependence of low-frequency neural power and coherence.

Figure 7—figure supplement 3.

Spectral power and MoC2 at 0.1 or 0.01 Hz for different arousal states. (A–P) n = 14 mice (n*two hemispheres in A,B,E,F,I,J,M,N) for all arousal states except Alert: n = 12 mice, Asleep: n = 13 mice. (A–D) Delta band power. (E–H) Theta band power. (I–L) Alpha band power. (M–P) Beta band power. Circles represent individual hemispheres of each mouse and diamonds represent population averages, with error bar showing ±1 standard deviation. Data is presented in Supplementary file 1. *p<0.05, **p<0.01, ***p<0.001 GLME.