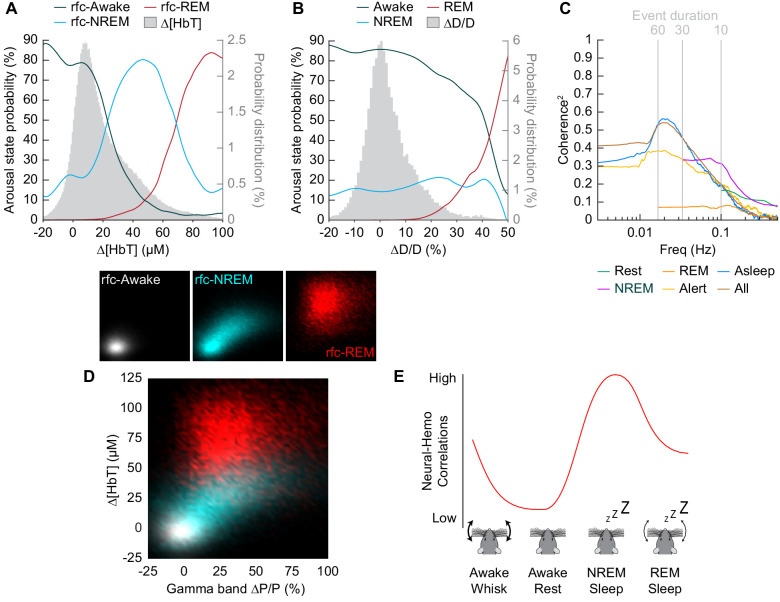
Figure 8. Influence of arousal state on vascular correlations to ongoing neural activity.
(A) Probability of being in a given arousal state as a function of mean ∆[HbT]. As ∆[HbT] increases, so does the probability that the animal is asleep. Temporal resolution is 5 s, ∆[HbT] bins have a 1 µM resolution. (B) Probability of being in a given arousal state as a function of mean ∆D/D. As ∆D/D increases, the probability that the animal is asleep is not well defined until reaching very large vasodilation. Temporal resolution is 5 s, ∆D/D bins are 1% resolution. (C) MoC2 between the envelope (≤1 Hz) of gamma band power and ∆[HbT] during each arousal state. Three additional states of alert, asleep, and all data are included to extend into the ultra-low frequencies. n = 14 mice. Alert arousal state n = 12; Asleep arousal state n = 13; All data arousal state n = 14. (D) Relationship between the gamma band power and ∆[HbT] during each arousal state. 5 s resolution. (E) Schematic demonstrating the observed relationship between ∆[HbT] and gamma band power during each arousal state.


