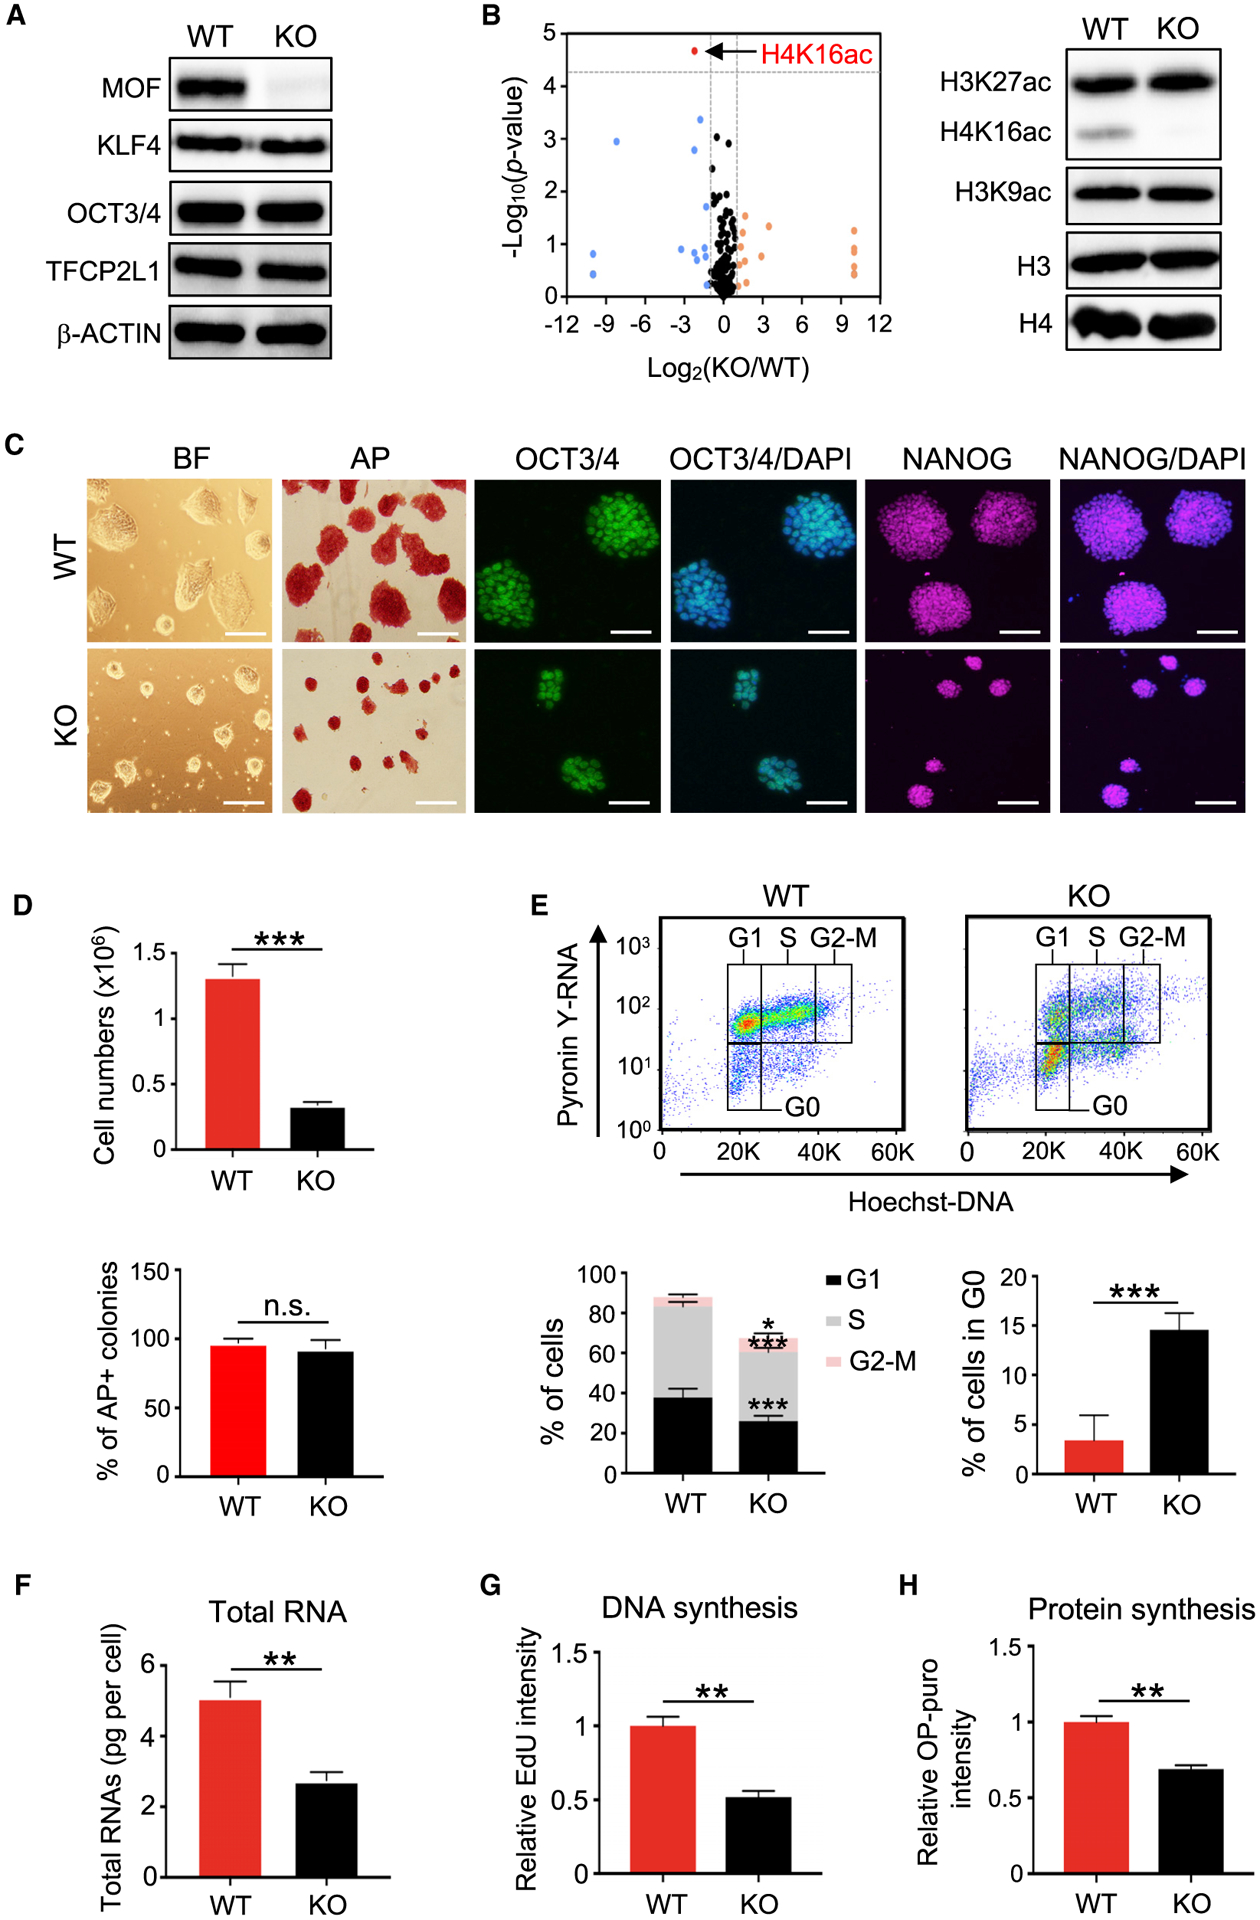
Figure 1. Deletion of Mof Induces a Pluripotent Quiescence in Ground-State ESCs.

(A) Western blot analysis in wild-type (WT) and Mof null 2i ESCs. β-Actin was included as a loading control.
(B) Left, volcano plot of mass spectrometry for 231 histone PTMs and unmodified peptides ranked by log2 fold change (KO/WT) (x axis) and the (−) log10 p value (y axis). Right, western blot validation of selected histone PTMs.
(C) Representative images of bright-field (BF), alkaline phosphatase (AP) staining, or immunofluorescence (IF) of OCT3/4 and NANOG for WT and Mof null 2i ESCs. Nuclei were co-stained with DAPI. Scale bar, 100 μm.
(D) Qualifications of cell numbers (top) and AP-positive colonies (bottom) from (C). Cells were plated at the same numbers and scored after 4 days. Data are shown as means ± SEMs from six biological replicates.
(E) Cell-cycle analysis. FACS plots (top) and quantifications (bottom) of six biological replicates are shown as means ± SEMs.
(F) Total RNA amounts per cell for WT and Mof null 2i ESCs. Data are presented as means ± SEMs from three independent experiments.
(G) Measurement of DNA synthesis. Quantifications of three biological replicates are shown as means ± SEMs.
(H) Measurement of new protein synthesis. Data are presented as means ± SEMs from three biological replicates.
For (D)-(H), *p < 0.05, **p < 0.01, ***p < 0.001; n.s., not significant.
