
Figure 2. MOF Directly Activates the FAO Pathway in Ground-State ESCs.
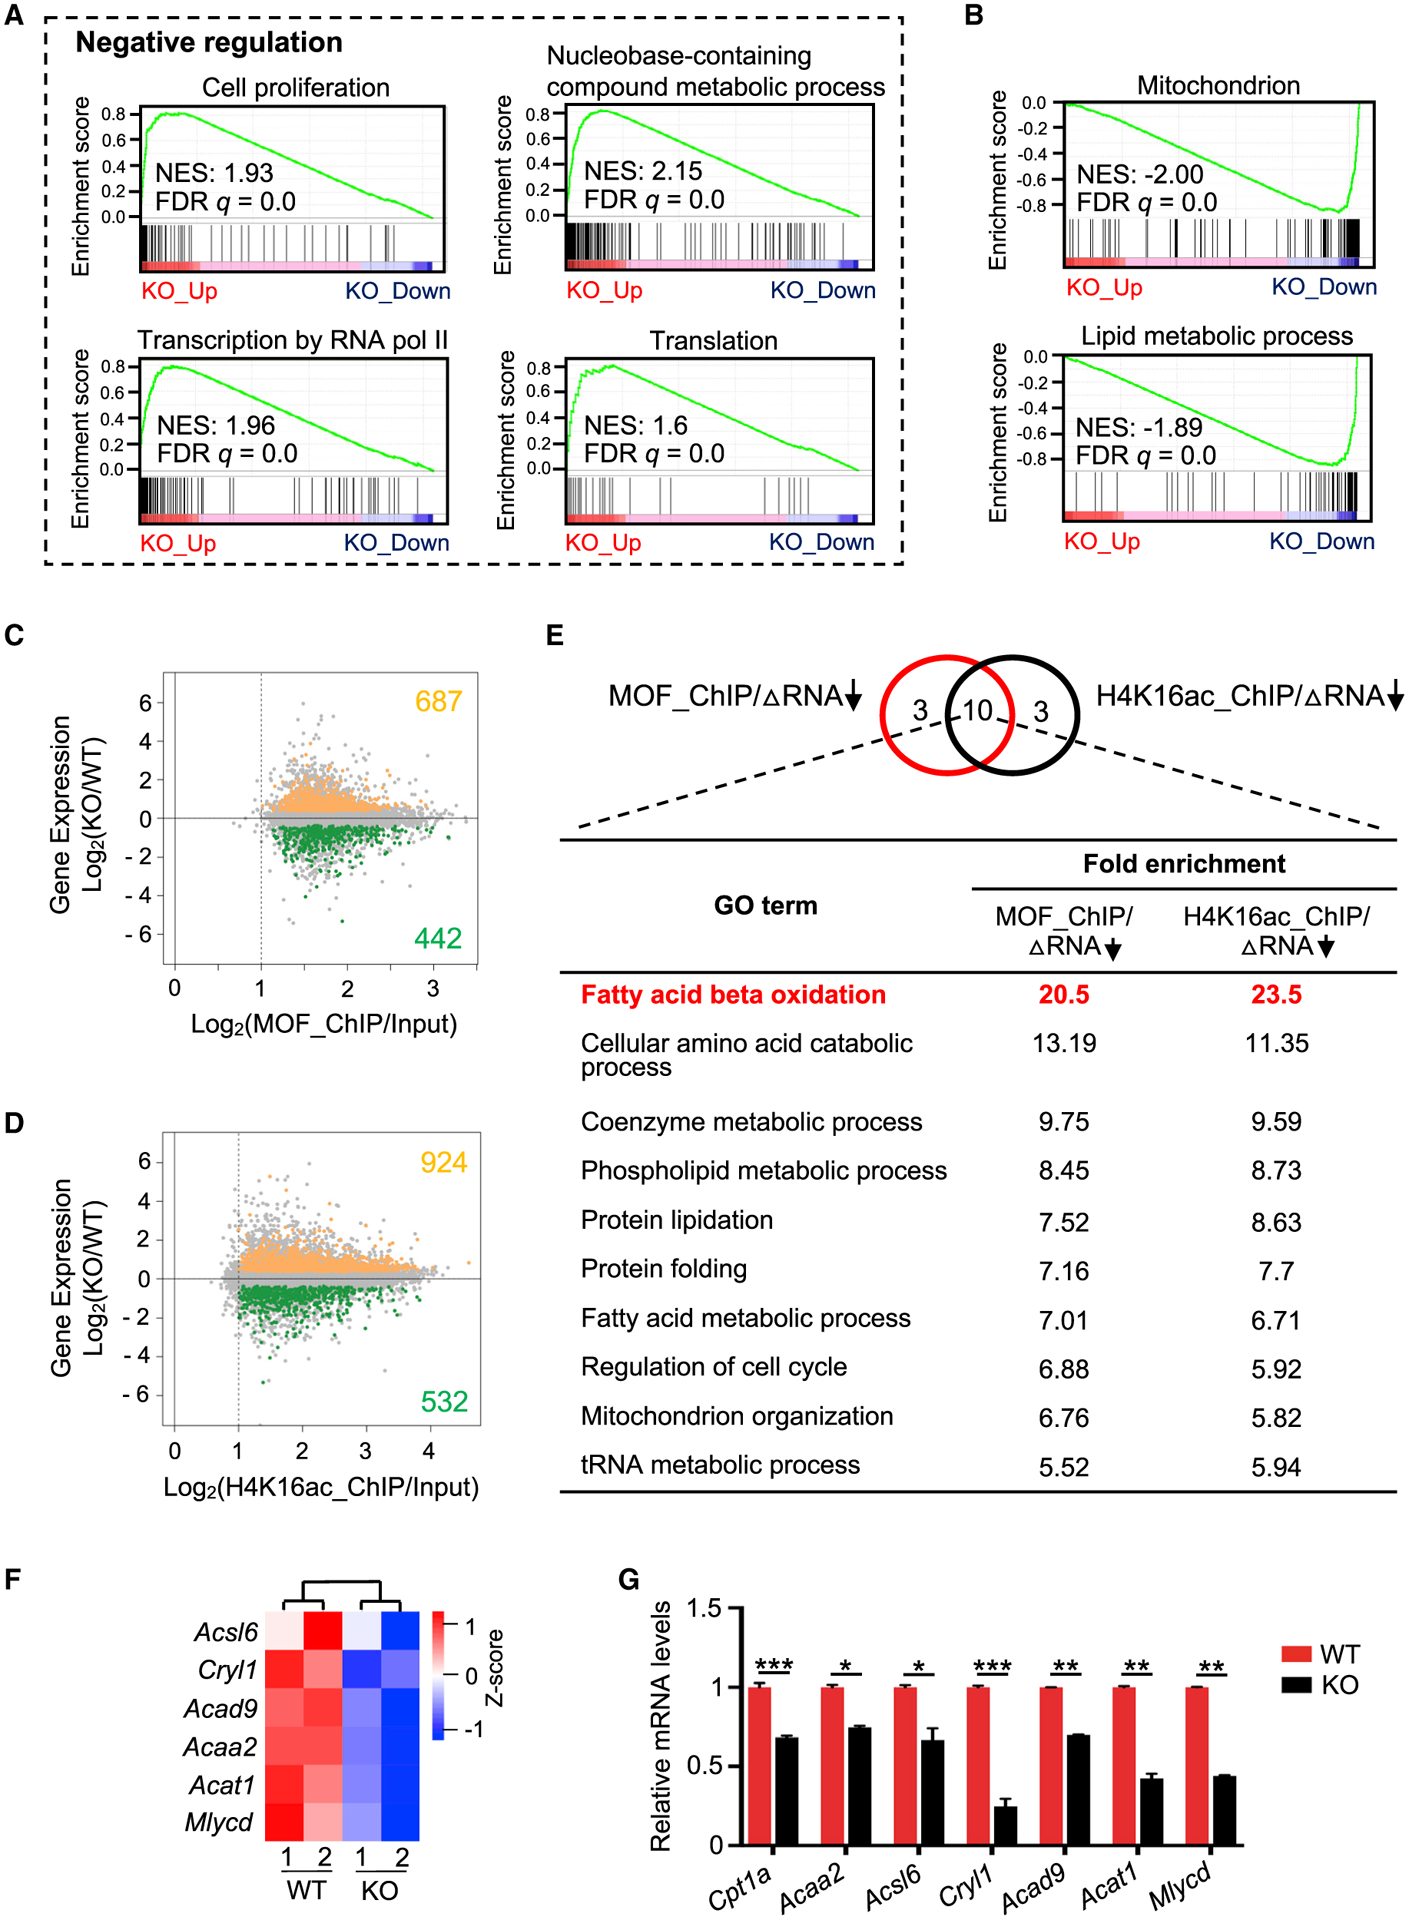
(A and B) GSEA plots for upregulated (A) and downregulated (B) genes in Mof null 2i ESCs. NES, normalized enrichment score.
(C and D) Intersection of RNA-seq (y axis) with ChIP-seq datasets (x axis) for MOF (C) and H4K16ac (D). See also Method Details.
(E) Top, Venn diagram for top 13 overrepresented GO terms for MOF or H4K16ac direct targets that were downregulated upon Mof deletion. Ten common metabolic pathways are shown at bottom.
(F) Heatmap (Z score) for the expression levels of FAO-related genes in WT and Mof null 2i ESCs. Heatmap key is shown at right.
(G) qRT-PCR validation for FAO-related genes. Relative expression from two biological replicates was normalized against the expression levels in WT ESCs, which was arbitrarily set as 1, and presented as means ± SEMs. *p < 0.05, **p < 0.01, ***p < 0.001.