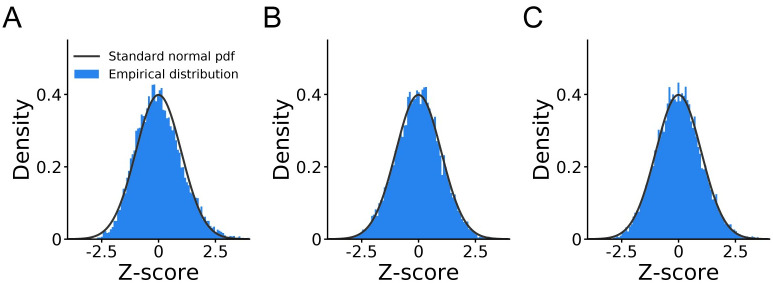
Fig 3. Normality of the IBS estimator.
A.z-score plot for the total number of samples used by IBS. B.z-score plot for the estimates returned by IBS, using the exact variance formula for known probability. C. Calibration plot for the estimates returned by IBS, using the variance estimate from Eq 16. These figures show that the number of samples taken by IBS and the estimated log-likelihood are (approximately) Gaussian, and that the variance estimate from Eq 16 is calibrated.

