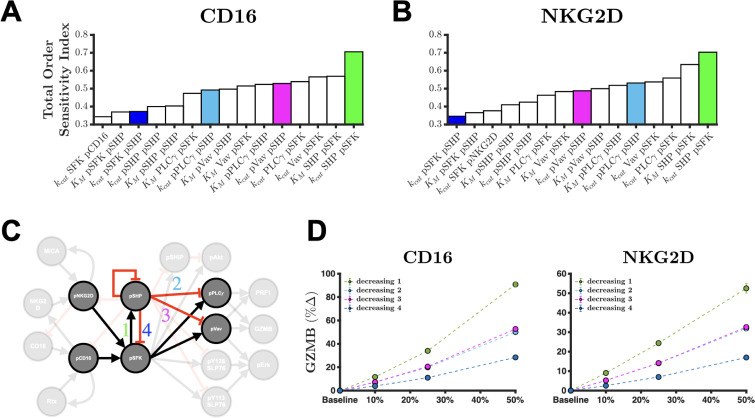
FIG. 3.
Sensitivity analysis shows that inhibition of pSHP activation is most influential for GZMB and PRF1 secretion. Total order sensitivity indices of the top fifteen influential parameters for the amount of GZMB secretion after 60 min of stimulation of the (a) CD16 pathway or (b) NKG2D pathway. (c) Almost all the influential parameters from the sensitivity analysis can be found in the pSFK-pSHP-pPLCγ-pVav sub-network of the full model. (d) Predicted percent change in GZMB secretion when decreasing the catalytic rate constants , parameters involved in the sub-network depicted in (c) after 60 min of stimulation of CD16 (left) and NKG2D (right). In panel (d): green, decreasing pSHP activation; blue, decreasing pSFK deactivation; magenta, decreasing pVav deactivation; cyan, decreasing pPLCγ deactivation; markers, mean model prediction; and error bars, one standard deviation.

