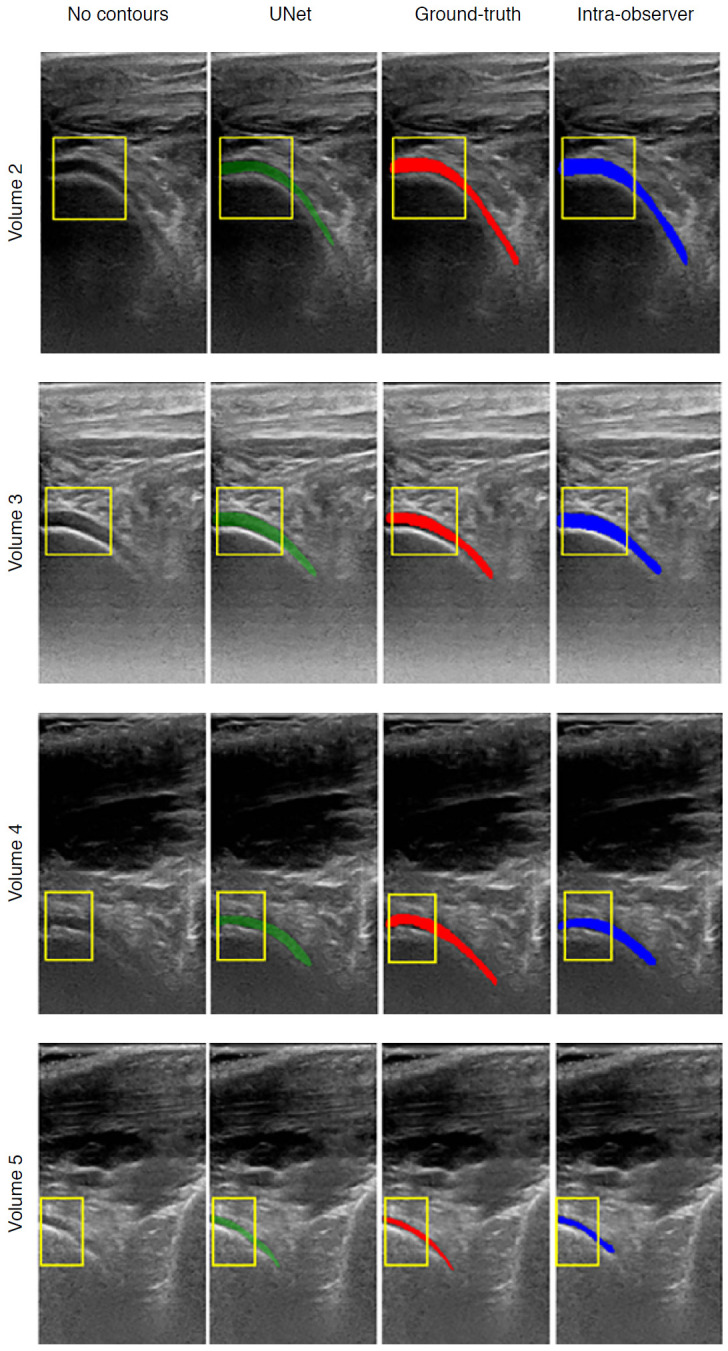
Fig. 8. Examples of cartilage segmentation based on a U-Net architecture [69].

The first column shows examples of images and image regions (yellow box) selected. For each US image in the figure, the segmentations produced by the U-Net (green), by the expert during the ground-truth creation (red), and the intraobserver test (blue) are shown. Reprinted from Antico et al. Ultrasound Med Biol 2020;46:422-435, Copyright (2020), with permission from Elsevier [69].
