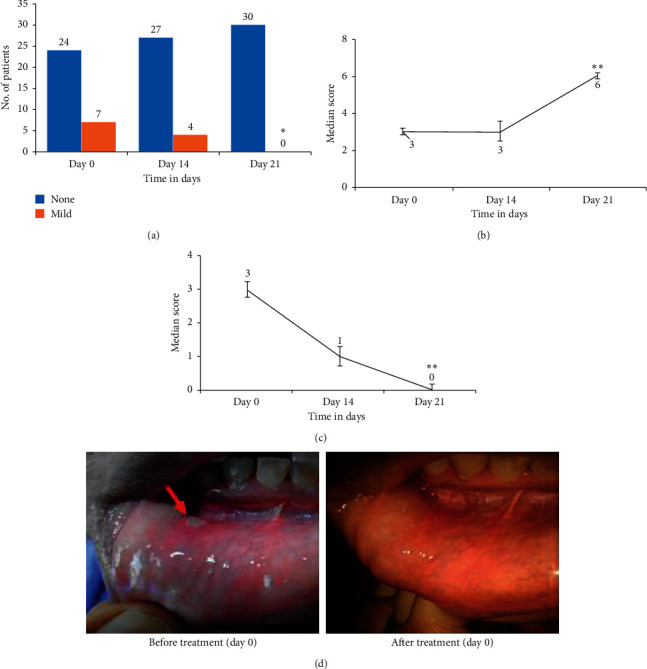
Figure 3.

Comparative analysis of data on clinical signs and symptoms of canker sore patients before (day 0) and after treatment (days 14 and 21) with THCs. (a) No. of patients with throat numbness at different time points of treatment, ∗p < 0.05 based on McNemar and Cochran's Q tests and as compared by chi-square test. (b) Median throat relief score at three points of treatment determined using Friedman ANOVA, ∗∗p < 0.001. (c) Median VAS pain score at different time points of treatment determined using Friedman ANOVA, ∗∗p < 0.001. (d) Visual evaluation.
