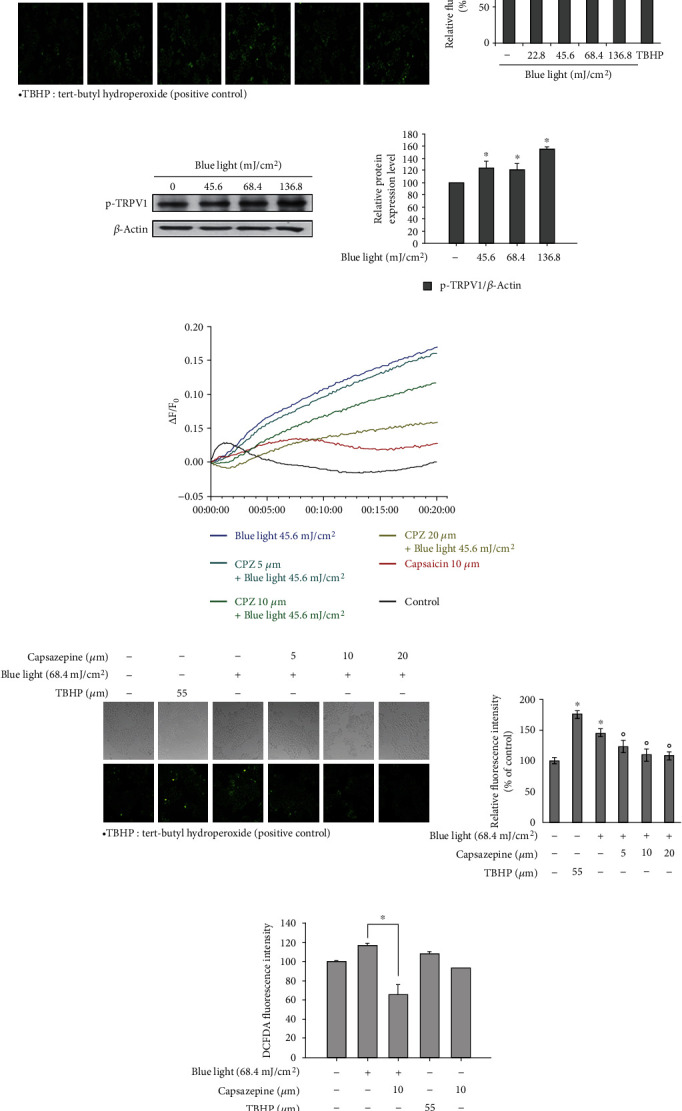
Figure 5.

ROS production via TRPV1 activation in response to blue light irradiation. (a) HaCaT cells were irradiated with the indicated intensity of blue light. After 24 hours, they were stained with DCFDA and fluorescent images were recorded. TBHP: tert-butyl hydroperoxide. The relative fluorescence intensity was also analyzed. ∗p < 0.05 vs. the control group. (b) HaCaT cells were irradiated using blue light with a wavelength of 470–480 nm once daily for three consecutive days. On the fourth day, 24 h after the last irradiation, the phosphorylation levels of TRPV1 were determined by Western blotting analysis. (c) Calcium influx into HaCaT cells was measured by the Fluo-4 Direct assay. After staining with the Fluo-4 reagent, the HaCaT cells were treated with capsazepine, a TRPV1 antagonist. After 30 minutes, the cells were washed with PBS and irradiated with the indicated intensity of blue light. Their fluorescence intensities were measured immediately after the irradiation. (d) HaCaT cells were treated with capsazepine (CPZ), a TRPV1 antagonist. After 30 minutes, they were washed with PBS and irradiated with the indicated intensity of blue light. After 24 hours, they were stained with DCFDA and fluorescent images were recorded. Data are presented as the mean ± SEM of four independent experiments. Statistical significance of differences among the groups was assessed by one-way analysis of variance (ANOVA), followed by Tukey's multiple comparison test, using the GraphPad Prism 5 software. ∗p < 0.05 vs. the control group. (e) DCFDA-stained cells were also analyzed by measuring their fluorescence using a microplate reader at an Ex/Em of 485/535 nm. The relative fluorescence intensity was also analyzed. ∗p < 0.05 vs. the untreated control, op < 0.05 vs. the blue light-irradiated control.
