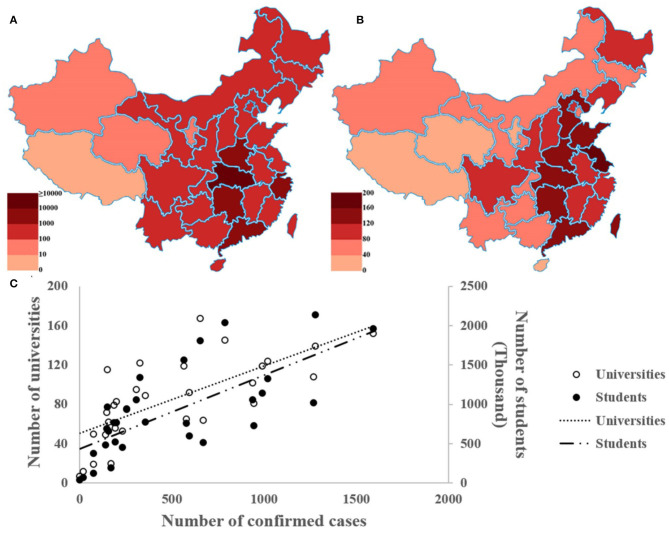
Figure 1.
Correlation between the cumulative case and university distribution in China. (A) The cumulative number of confirmed cases in China. (B) The distribution of universities in China. (C) The Scatterplots of cumulative diagnosis and the number of universities and students in China. This figure is original and based on data from National Health Commission of the People's Republic of China (7) and Ministry of Education of the People's Republic of China (11).

