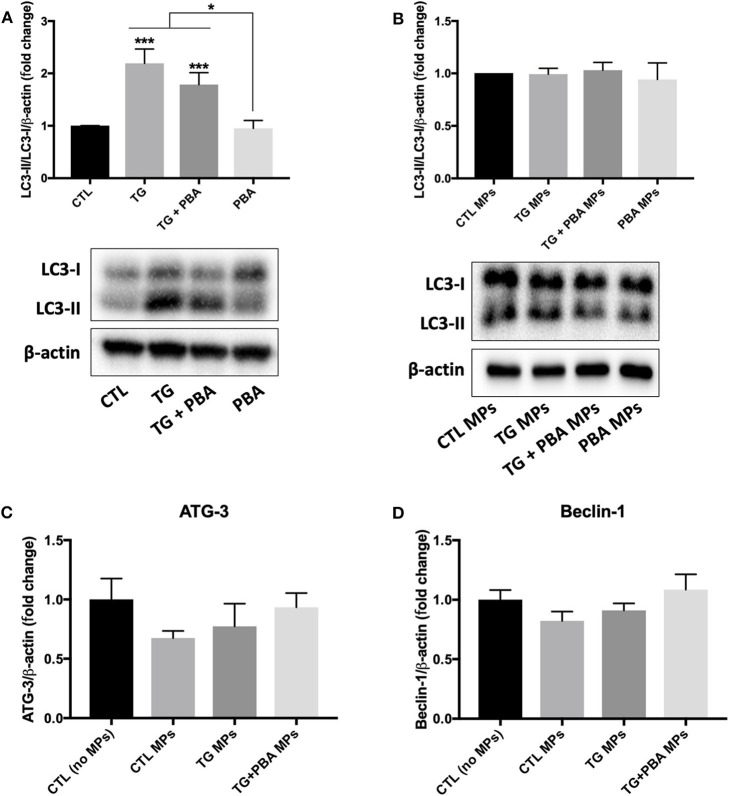
Figure 11.
Differential effects between TG and TG-generated MPs on autophagy activation. (A,B), Western blot analysis of autophagy marker (LC3 I/II) in HUVECs treated with TG (300 nM, 24 h) in the presence or absence of PBA (10 mM) (A) or treated with CTL MPs, TG MPs, TG+PBA MPs or PBA MPs at a concentration of 20 μg/ml for 48 h (B) (n = 3–6 per group). Bars represent autophagic rate expressed as the ratio of densitometry signal for LC3-II normalized to LC3-I and to total amount of β-actin loading control expressed as fold change compared to control (CTL or CTL MPs) (n = 4–6 per group). (C,D), relative mRNA expression levels of ATG-3 (C) and Beclin-1 (D) after treatment with MPs (20 μg/ml for 48 h) normalized against housekeeping gene β-actin (n = 3 per group). Data are presented as mean ± SEM. One-way ANOVA test was used for analysis and Tukey's multiple comparison test was used as a post-hoc test. *P < 0.05, ***P < 0.001 vs. CTL or vs. indicated groups.

