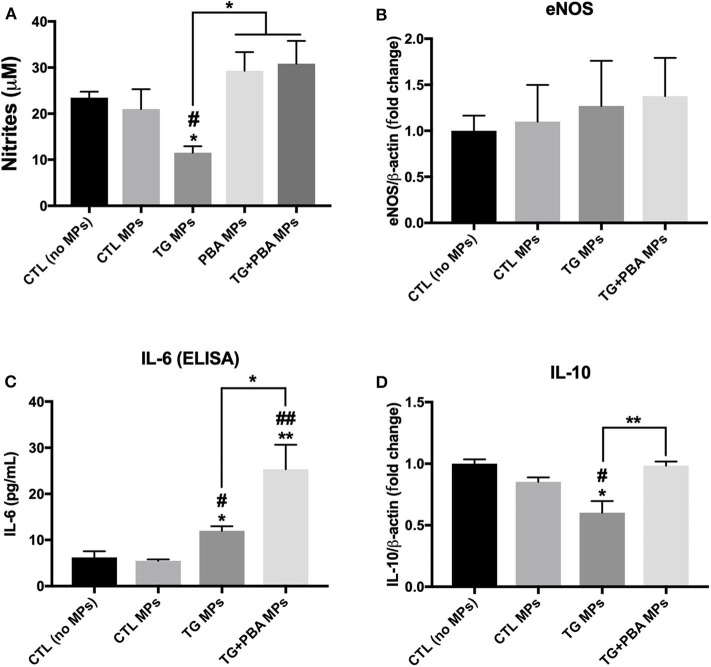
Figure 8.
Effects of TG-generated MPs on inflammatory cytokines and NO release. (A), Nitrites concentration (μM), indicator of NO levels, in culture media from untreated HUVECs (CTL, no MPs) and cells treated with CTL MPs, TG MPs, TG+PBA MPs or PBA MPs at a concentration of 20 μg/ml for 48 h (n = 6 per group). (B), Relative mRNA expression of eNOS in HUVECs after treatment with MPs (20 μg/ml for 48 h) normalized against housekeeping gene β-actin (n = 3 per group). (C), IL-6 concentrations (pg/ml) determined by ELISA in culture media from control (No MPs) HUVECs and those treated with CTL MPs, TG MPs, TG + PBA MPs or PBA MPs at a concentration of 20 μg/ml for 48 h (n = 3). (D), Relative mRNA expression levels of IL-10 in HUVECs after treatment with MPs (20 μg/ml for 48 h) normalized against housekeeping gene β-actin (n = 3 per group). Data are presented as mean ± SEM. One-way ANOVA test was used for analysis and Tukey's multiple comparison test was used as a post-hoc test. *P < 0.05, **P < 0.01 vs. control (No MPs) or vs. indicated groups; #P < 0.05, ##P < 0.01 vs. CTL MPs.

