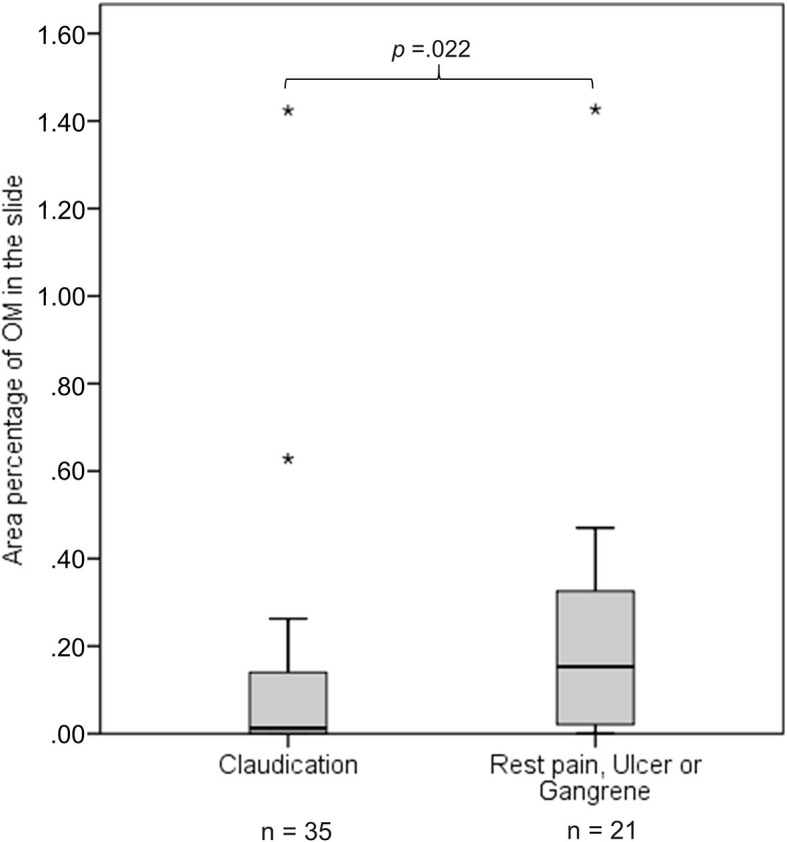
Figure 3.

The figure presents as boxplots the area percentage of osteoid metaplasia (OM) in a slide for patients with claudication and patients with rest pain, ulcer, or gangrene. Area percentage of OM in the slide differs significantly between male patients (n = 56) with claudication and male patients with rest pain, ulcer, or gangrene. p is calculated using Mann–Whitney U-test. Outliers are marked with stars.
