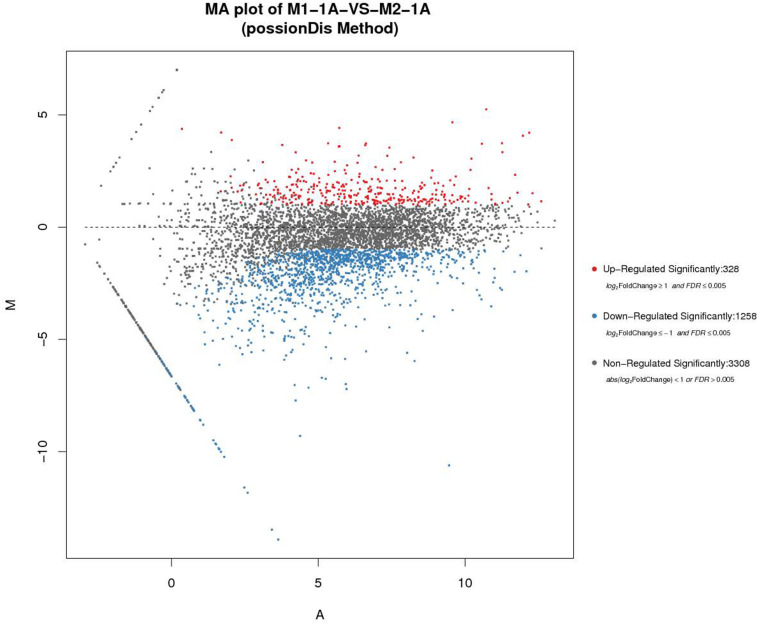
FIGURE 5.
The comparison and analysis of transcriptomic data of the two samples. MA (Bland–Altman) plot of M1-1A: pure culture of R. equi CGMCC14861; M2-1A:co-culture of R. equi CGMCC14861. The horizontal axis represents the average expression level after logarithmic conversion, which represents the value of A. The larger the value, the higher the expression level. The vertical axis represents the difference multiple after logarithmic conversion, representing the M value. The greater absolute M value of a gene indicates greater difference in the expression level of the gene in the difference pair.

