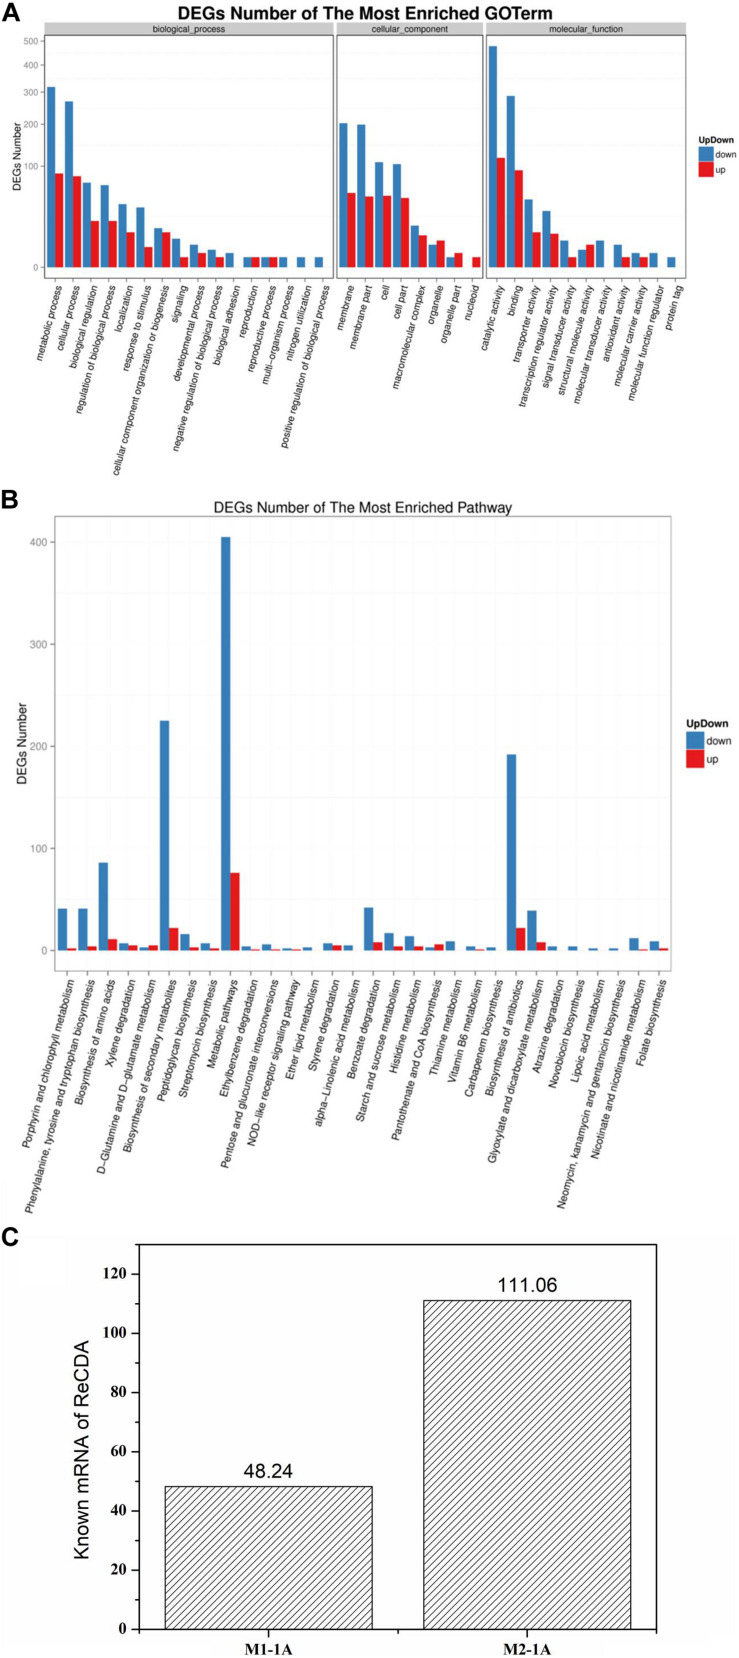
FIGURE 6.
Gene ontology (GO) function and pathway analysis of significantly up- and downregulated differentially expressed genes (DEG) and the transcription level of ReCDA. (A) GO functional classification of significantly up- and downregulated DEGs. The horizontal axis represents GO terms, and the vertical axis represents the number of significantly up- and downregulated DEGs in the corresponding GO terms. (B) Kyoto encyclopedia of genes and genomes (KEGG) classification of significantly up- and downregulated DEGs. The horizontal axis represents the pathway enriched with DEGs (in order of significance of enrichment; significance of enrichment decreases successively from left to right), and the vertical axis represents the number of significantly up- and downregulated DEGs in the corresponding pathway. (C) Comparison of the transcription level of ReCDA-coded genes.

