FIGURE 3.
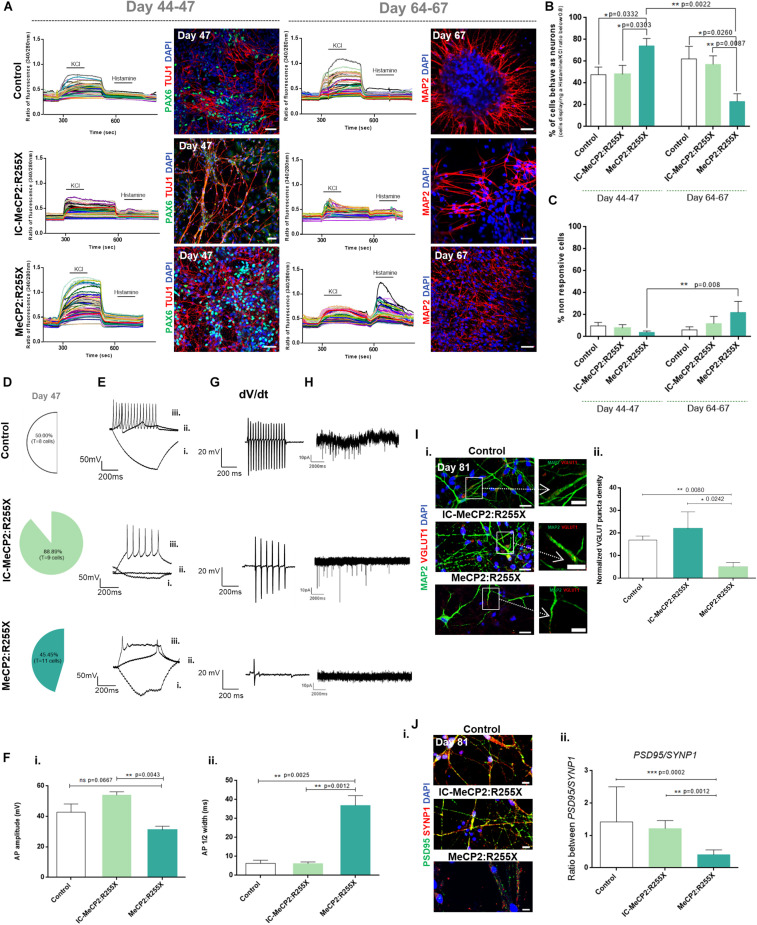
Functional analysis of dorsal forebrain organoids during maturation. (A–C) Single cell calcium imaging (SCCI) of dorsal organoids. (A) Representative fluorescence ratio profiles (left) of individual cells on days 44–47 and 64–67. Representative immunofluorescence images (right) for the neural progenitor marker PAX6 and for the new-born neuronal marker TUJ1 on days 44–47 and for the mature neuronal marker MAP2 on days 64–67. Immunofluorescence analysis was performed by using the cultures previously analyzed by SCCI. Scale bar 50 μm; (B) Percentage of cells displaying a Histamine/KCl ratio below 0.8, which is indicative of the% of cells functionally behaving like neurons. (C) Percentage of cells that neither respond to histamine neither to KCL. Total number of cells analyzed (n = independent experiments): Control: n = 6 with 618 cells analyzed at day 44–47 and 407 cells analyzed at days 64–67; IC-MeCP2:R255X: n = 4 with 358 cells analyzed at days 44–47 and 271 cells analyzed at days 64–67; MeCP2:R255X: n = 3 with 461 cells analyzed at day 44–47 and 415 analyzed at days 64–67. (D–G) Patch-clamp recordings of single cells at day 47. (D) Percentage of cells depicting at least one firing action potential (AP). (E) Representative traces of firing responses evoked under current-clamp mode by injection of a 500 ms current pulse [–25 (i) to +275 pA in 25-pA increments (ii,iii) from an initial holding potential (Vh) of –70 mV]. Scale bars correspond to 50 pA and 200 ms. (F) (i) AP amplitudes measured from the first AP depicted; (ii) Half-peak width measured from the first AP depicted. (G) Representative views of the AP velocity firing near threshold (dV/dt). Scale bars correspond to 20 pA and 200 ms. (H) Representative recordings of spontaneous postsynaptic currents. Scale bars correspond to 10 pA and 2000 ms. (I) (i) Representative immunofluorescence images of 4–5 days-old replated organoid cultures stained for VGLUT1 and MAP2. Scale bar 20 μm. Representative amplification of neurons showing VGLUT1 puncta on MAP2 neurites. Scale bar 10 μm. (ii) Normalized density of VGLUT1 pre-synaptic puncta. n = independent experiments; Control: n = 7; IC-MeCP2:R255X: n = 4; MeCP2:R255X: n = 6. (J) (i) Immunofluorescence images of PSD95 and SYNP1. The overlap between PSD95 and SYNP1 (yellow) indicate sites of synaptogenesis. Scale bar 10 μm. (ii) PSD95/SYNP1 ratio measured from immunofluorescence images. For all graphics depicted, Student’s t-test (two-tailed) statistics was applied: *p < 0.05, **p < 0.01, ***p < 0.001; error bars represent SEM.

