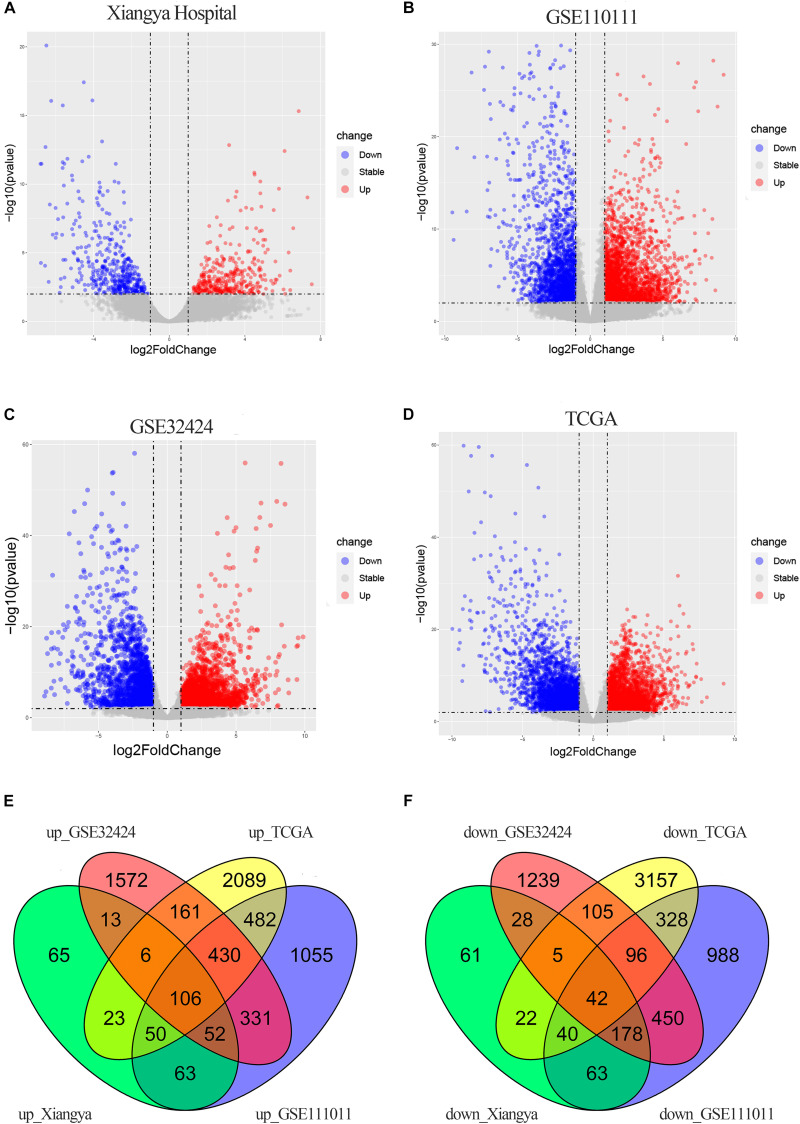
FIGURE 2.
DEGs in ESCC. (A–D) Volcano plots showing DEGs in the discovery data sets: Xiangya Hospital (A), GSE111011 (B), GSE32424 (C), and TCGA_ESCC (D). Dark circles represent genes without significant differential expression (FDR > 0.01), red circles represent upregulated mRNAs with significant differential expression [log2(fold change) >1 and FDR < 0.01], and blue circles represent downregulated mRNAs with significant differential expression [log2(fold change) <1 and FDR < 0.01]. The top 20 upregulated and downregulated genes are listed. (E,F) Venn diagrams of the overlapping DEGs, including 106 upregulated (E) and 42 downregulated (F) genes, from the four data sets.

