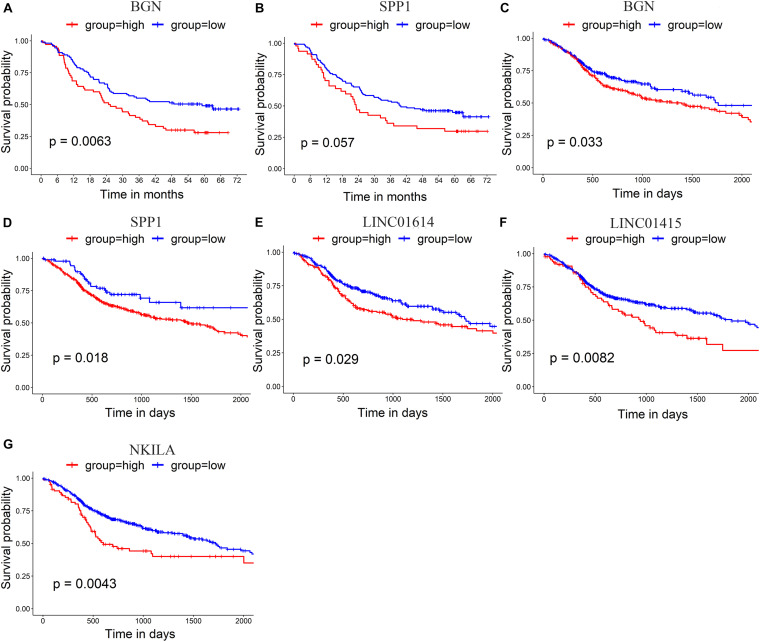
FIGURE 5.
(A,B) Survival analysis of GSE53625 by log-rank test shows that higher expression of BGN and SPP1 is related to poor survival. (C–G) Survival analysis of TCGA _HNSCC by log-rank test shows that higher expression of BGN (C), SPP1 (D), LINC01614 (E), LINC01415 (F), and NKILA (G) is related to poor survival in HNSCC.

