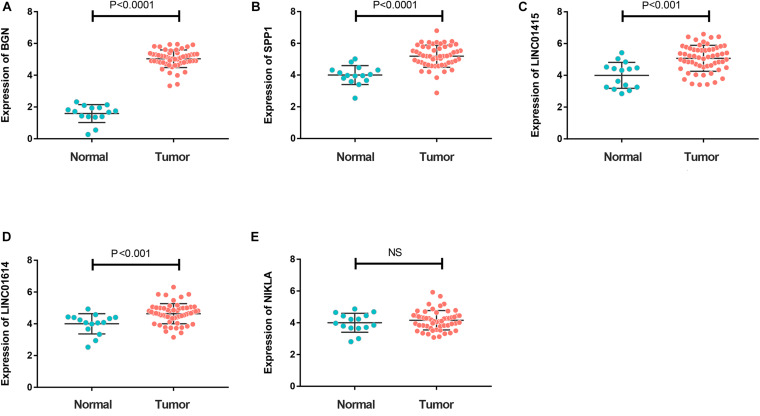
FIGURE 6.
(A–D) Reverse transcription-quantitative polymerase chain reaction (RT-qPCR) showing much higher expression of BGN (A), SPP1 (B), LINC01415 (C), and LINC01614 (D) in ESCC tumor tissues compared with that in normal tissues (P < 0.05). (E) A similar expression of NKILA was observed in tumor and normal samples. The mean gene expression in normal tissue was used as a reference to calculate the value of 2– ΔΔCt. NC, negative control.

