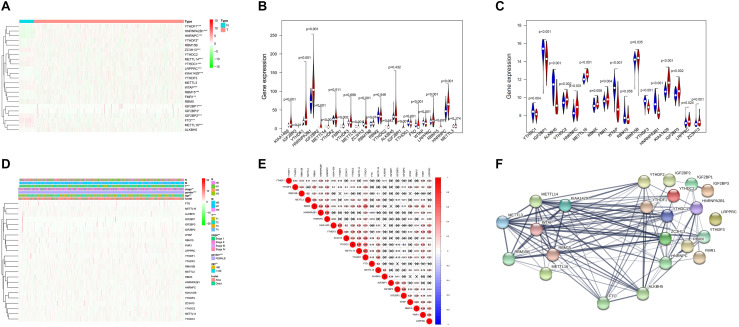
FIGURE 2.
Expression and correlation of m6A RNA methylation regulation factors in breast cancer. (A) Expression heatmap of 23 m6A RNA regulators in breast cancer tissues and normal tissues. Vioplot demonstrates the expression of the regulation factors with the comparison between breast cancer tissues and normal tissues through the data from The Cancer Gene Atlas (TCGA) (B) and Gene Expression Omnibus (GEO) (C). The white spot in every “violin” presents the median expression level. (D) The correlations between m6A RNA methylation regulators and clinicopathological features. (E) Spearman correlation analysis of m6A RNA methylation regulators. (F) The PPI network of m6A RNA methylation regulators. *p < 0.05, **p < 0.01, ***p < 0.001.

