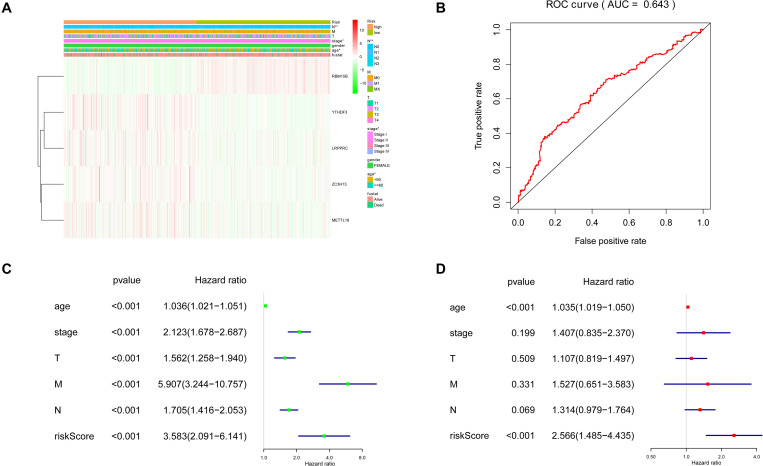
FIGURE 5.
Clinicopathological features of the two risk subgroups based on five selected regulators. (A) The heatmap shows the expression levels of five m6A RNA regulators in high and low-risk groups. (B) The receiver operating characteristic (ROC) curves were used to validate the predictive specificity and sensitivity. The association between clinicopathological factors and overall survival of breast cancer patients through univariate (C) and multivariate (D) Cox regression analyses.

