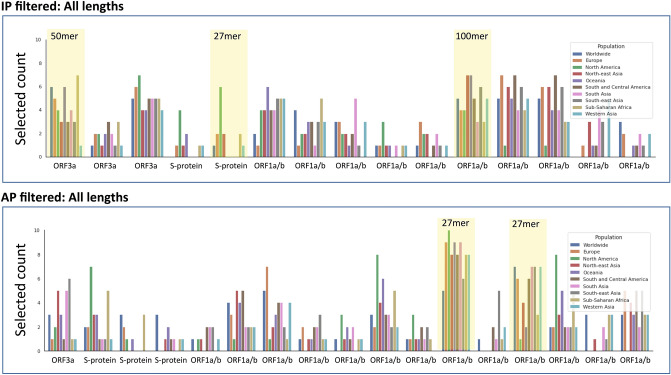
Figure 7.
The plot illustrates a set of digital twin simulation experiments to identify effective epitope hotspots based on immune presentation (IP) and antigen presentation (AP), which broadly cover the population. The aim of the analysis was to select an optimum set of hotspots (respecting a given budget) such that the likelihood that each citizen (in a given modelled population) has a positive response is maximized (or, equivalently, that the log likelihood of no response for each citizen is minimized). Ten simulations were run for each region illustrated, where each simulation consisted of 10,000 digital twins (see supplementary file for more details). This plot shows the number of times each hotspot was selected for use in one of the simulations. Each hotspot selected at least 10 times is shown on the x-axis, and the y-axis shows the selected counts per region. Each bar corresponds to a different region-specific simulation setting. A subset of 5 hotspots were selected based on their profile across the AP and IP digital twin analyses, which could theoretically provide coverage of > 90% across a global population (highlighted in yellow).

