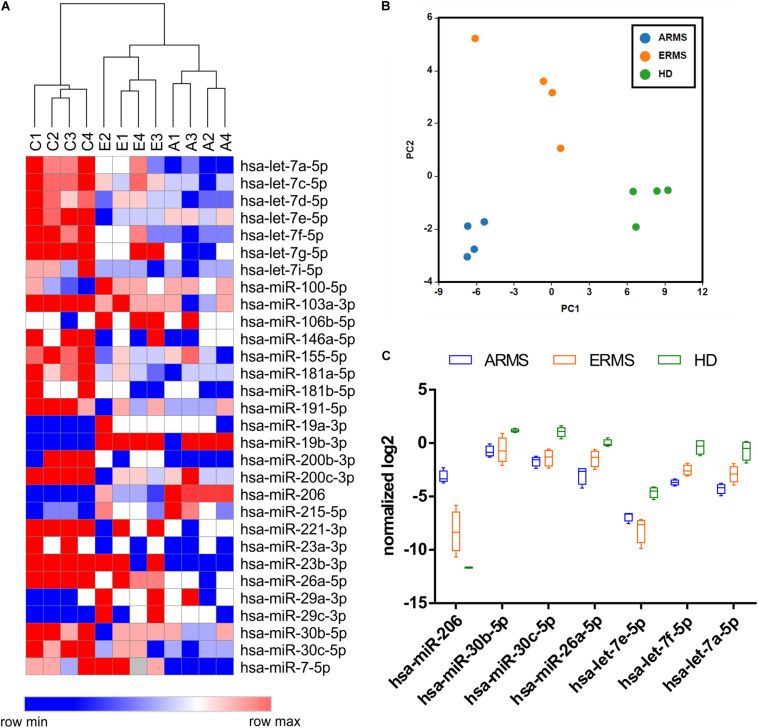
FIGURE 1.
Circulating miRNAs expression profiles distinguish RMS patients from healthy donors. (A) The heatmap shows the circulating miRNAs expression profiles in 8 RMS samples (4 ERMS and 4 ARMS PAX3/FOXO1) and 4 healthy donors based on hierarchical clustering. The statistically different miRNAs were obtained using both global mean and 5 reference genes normalization. (B) The Principal component analysis (PCA) shows the clear separation of three groups (HD, ERMS, and ARMS) based on circulating miRNAs expression patterns. (C) Box plots of relevant miRNAs deregulated in RMS respect to HD are reported. C1–4 = healthy donors; A1–4 = alveolar RMS; E1–4 = embryonal RMS.

