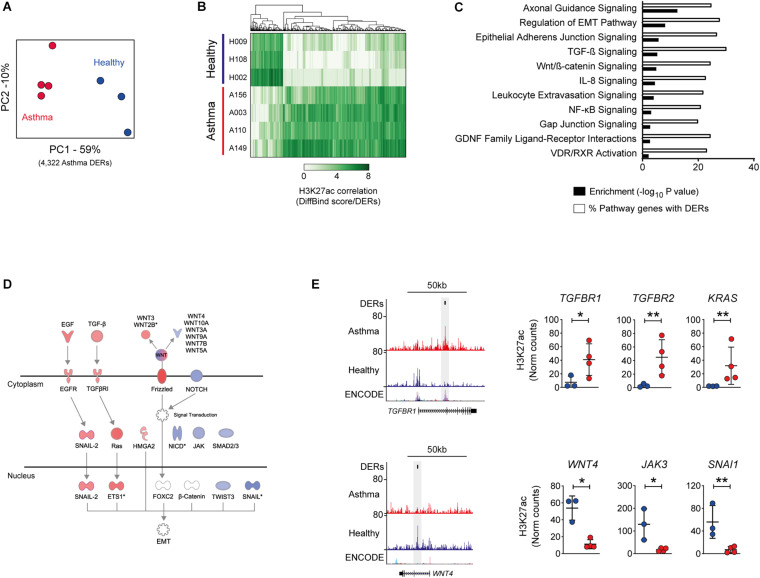
FIGURE 1.
Influence of asthma on the epigenome of the airway epithelium. (A) Principal component analysis of H3K27ac across differentially enriched regions (DERs) identified by DiffBind. Clustering identifies variation both between and within healthy (blue) and asthma (red) BECs. (B) Heatmap depicting volunteer correlation across asthma DERs and the presence of gain and loss of H3K27ac in asthma BECs. (C) DER-associated genes are enriched in pathways associated with epithelial biology and asthma pathophysiology (–log10 P-values, black bars). Pathway analysis also revealed that up to 30% of genes within the same pathway exhibited differential H3K27ac in asthma (% of pathway genes with DERs, white bars). (D) Condensed versions of the epithelial-to-mesenchymal transition (EMT) pathway depicting how numerous components are within the same pathway gain (red) and lose (blue) H3K27ac in asthma BECs. (E) Genome tracks depicting H3K27ac enrichment in BECs across example gain (TGFBR1) and loss asthma DERs (WNT4). Data tracks from bottom to top; genes (RefSeq annotation), layered H3K27ac from ENCODE, merged data from healthy (n = 3, blue) and asthma BECs (n = 4, red) and Asthma DERs (black boxes). Dot plots depict enrichment across volunteers at select genes with gain and loss DERs (*P < 0.05, **P < 0.01, DiffBind). Asthma = red, healthy = blue.

