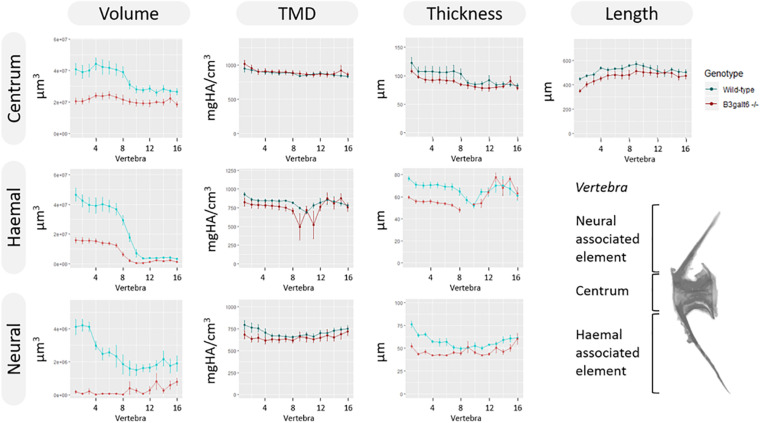
FIGURE 6.
μCT analysis of adult WT and b3galt6–/– zebrafish. Quantitative μCT analysis of the vertebral column in five mutants vs. five WT zebrafish at the age of 4 months. The bone volume, tissue mineral density (TMD) and bone thickness were calculated for three parts of each vertebra: the vertebral centrum, the neural associated element (neural arch and neural spine) and the haemal associated element (haemal arch and haemal spine). Plots associated with a significant difference are colored in a lighter coloring scheme. The X-axis represents each vertebra along the anterior-posterior axis. The volume is significantly reduced for each part of the vertebra in b3galt6–/– zebrafish (P < 0.01, P < 0.001, and P < 0.000001, respectively). The thickness of the haemal (P < 0.01) and neural (P = 0.001) associated element is also significantly reduced in the mutants whereas the centrum thickness is not significantly reduced in b3galt6–/– zebrafish (P = 0.12). TMD is not significantly different between b3galt6–/– zebrafish and WT siblings when not normalized for standard length (P > 0.2). Data are presented as mean ± SEM. TMD, tissue mineral density; HA, hydroxyapatite.

