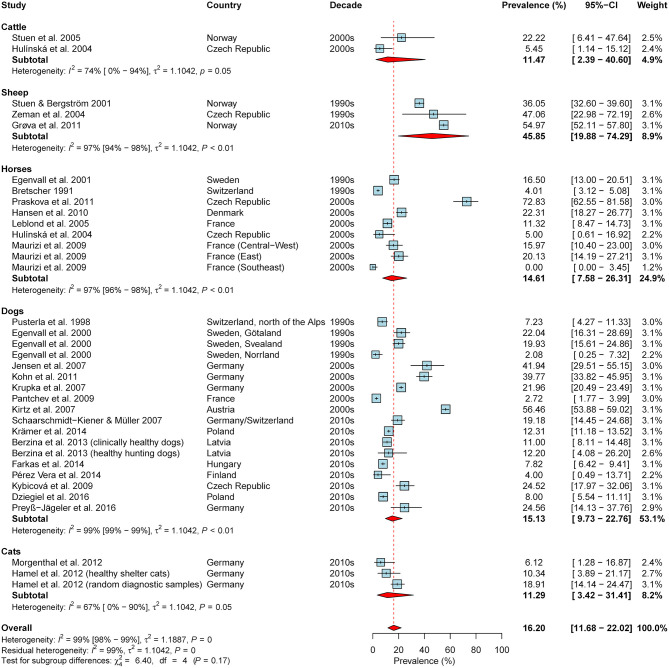
Figure 6.
Forest plot displaying the results of random-effects meta-analysis of A. phagocytophilum seroprevalence in domestic animals, with subgroup analysis according to animal species. Individual study results are shown as blue squares, corresponding in size to the weight of the study on the overall prevalence estimate. Error bars indicate 95% confidence intervals (CI). Pooled prevalences are shown as red diamonds and the red dotted vertical line indicates the estimated overall prevalence.

