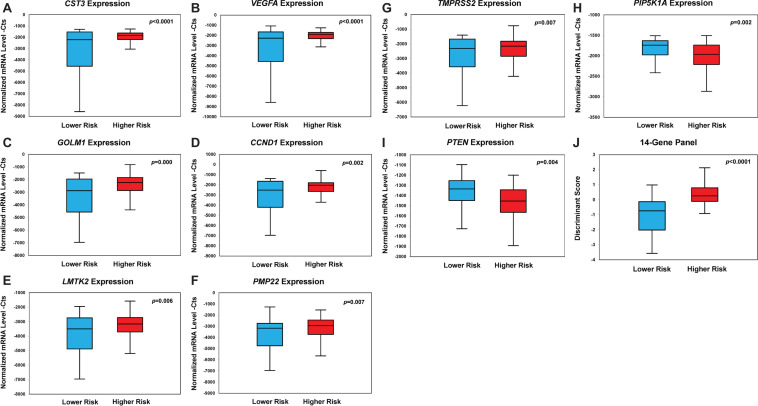
FIGURE 2.
Box plots of genes with statistically significant differential gene expression in the prospective PCa urine cohort (n = 202). Box plot of expression of CST3 (A), VEGFA (B), GOLM1 (C), CCND1 (D), LMTK2 (E), PMP22 (F), TMPRSS2 (G), PIP5K1A (H), PTEN (I), and the 14-Gene Panel (J). Normalized mRNA level—Cts is defined as cycle threshold (Ct) (sample)/Ct (actin) * 1,000.

