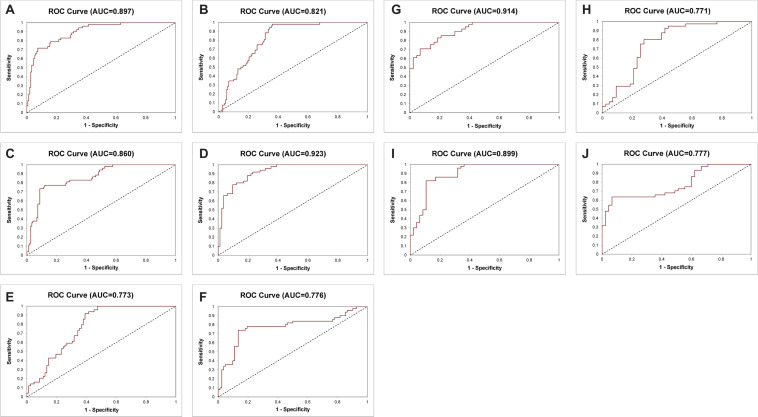
FIGURE 3.
Receiver operating characteristic curves of the 14-Gene Panel, serum prostate-specific antigen (PSA) and Gleason score for diagnosis of higher-risk and lower-risk PCa. ROC curve of the 14-Gene Panel (A), PSA (B), and Gleason score (C) in the prospective PCa urine cohort (n = 202). ROC curve of the 14-Gene Panel (D), PSA (E), and Gleason score (F) in patients with Gleason scores 6 and 7 in the prospective PCa urine cohort (n = 132). ROC curve of the 14-Gene Panel (G) and PSA (H) in patients with Gleason score 7 in the prospective PCa urine cohort (n = 84). ROC curve of the 14-Gene Panel (I) and Gleason score (J) in the retrospective PCa urine cohort (n = 97).

