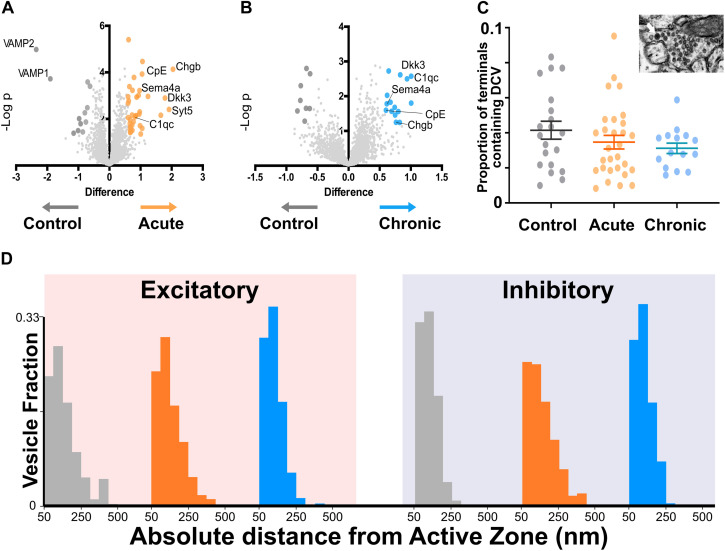
FIGURE 3.
Proteomics analysis of synaptosomes reveal an increase of proteins involved in vesicular positioning. (A,B) Differentially expressed proteins in Control vs. Acute (A) and Chronic epileptic phase (B). Volcano plots are built plotting average ratio of TeNT vs. corresponding control against their t-test log P-values; significance thresholds: FDR > 0.05 and fold change > 0.6. Proteins significantly upregulated in Acute and Chronic tetanic animals are highlighted, respectively, in orange and light blue; proteins significantly downregulated are in dark gray. Proteins abbreviations are Dkk3, Dickkopf-related protein 3; Sema4a, Semaphorin 4A; Cpe, carboxypeptidase e; Chgb, chromogranin b; Syt5, synaptotagmin5; VAMP1, Vesicle-associated membrane protein 1; VAMP2, Vesicle-associated membrane protein 2; C1qc, Complement C1q C Chain. (C) Proportion of presynaptic terminals containing Dense Core Vesicles in different non-overlapping sampled areas of Control (gray; n = 20), Acute (orange; n = 29), and Chronic (blue; n = 15) groups. No differences between groups (One Way ANOVA, p = 0.2869). Data are represented as mean ± SEM. Inset, a representative image of Dense Core Vesicles. (D) Right: Distribution of distances of non-released vesicles from active zone at excitatory synapses in Chronic (gray; n = 2140), Acute (orange; n = 2503), and Chronic (blue; n = 5705) groups (One-way ANOVA; F = 238.15, p < 0.0001, Control vs. Actute: p < 0.0001; Control vs. Chronic: p < 0.0001). Left: Distribution of distances of non-released vesicles from active zone at inhibitory synapses in Chronic (gray; n = 543), Acute (orange; n = 717), and Chronic (blue; n = 1520) groups (F = 75.57, p < 0.0001, Control vs. Actute: p < 0.0001; Control vs. Chronic: p > 0.05).

