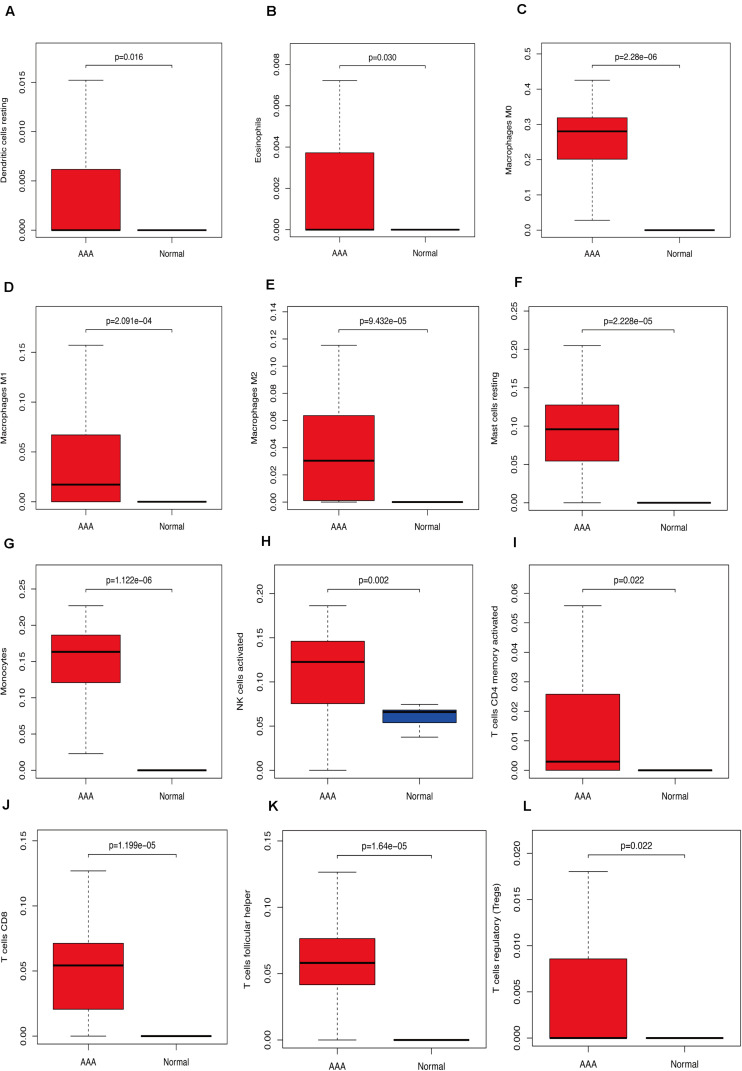
FIGURE 3.
Immunocyte expression ratio, red represents the expression of immune cells in abdominal aortic aneurysm, and blue represents the expression of immune cells in normal vascular tissues. (A) The expression of resting dendritic cells. (B) The expression of eosinophils. (C) The expression of macrophages M0. (D) The expression of macrophages M1. (E) The expression of macrophages M2. (F) The expression of resting mast cells. (G) The expression of monocytes, (H) Activated NK cell expression, (I) activated CD4 memory cell expression, (J) CD8 cell expression, (K) follicular helper cell expression, (L) T regulatory cell (Tregs) expression.

