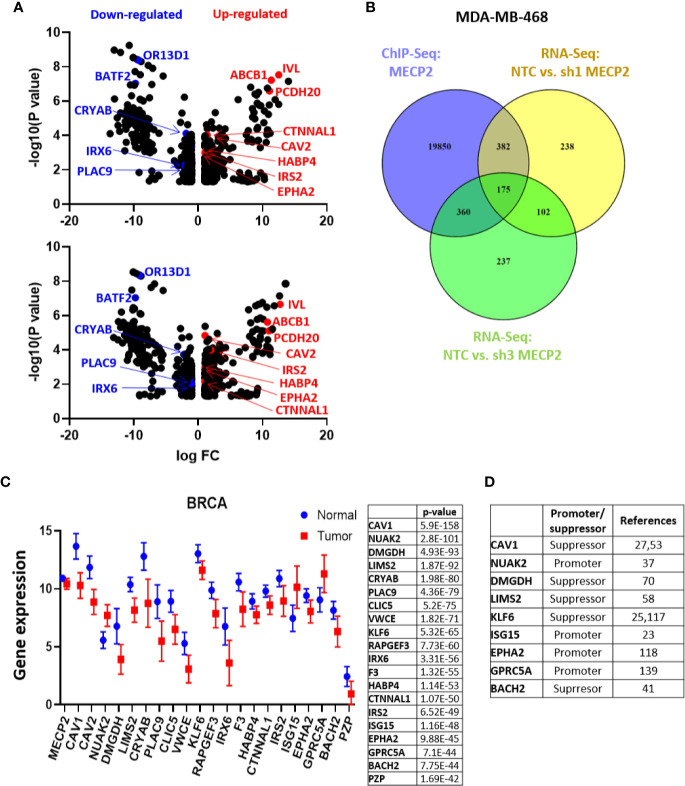
Figure 3.
MeCP2 depletion induces transcriptional changes in MDA-MB-468 cells. (A) A volcano plot showing up-regulated (red) and down-regulated genes (blue) in RNA-Seq analysis between NTC and sh1 MeCP2 (upper panel) and NTC vs sh3 MeCP2 (bottom panel). (B) Venn diagram representing overlap of MeCP2 ChIP-Seq peaks and RNA-Seq analysis in MDA-MB-468 cells. (C) Differential expression of 20 selected genes of the 175 genes common in MDA-MB-468 ChIP-Seq and RNA-Seq. (D) Role of selected genes in cancer tumorigenesis.

