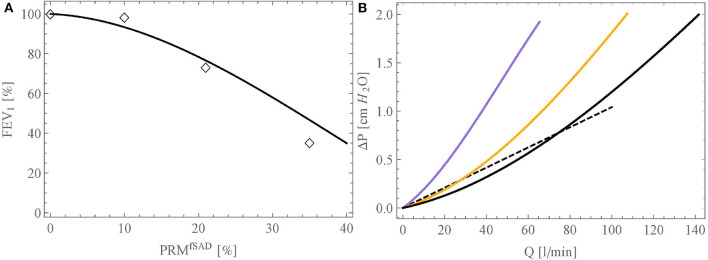
Figure 6.
(A) Link between FEV1 (in % of its reference value in healthy subjects) and PRMSAD obtained with our model (black curve). The open diamonds represent the experimental data of Criner et al. (2019). (B) Relation between inspiration flow rate and pressure drop in the bronchial tree, calculated with the model, for three situations: healthy lungs (black curve), lungs with PRMfSAD = 21% (orange curve), and lungs with PRMfSAD = 35% (purple curve). The dashed curve presents the linear relation of Ferris et al. (1964).

