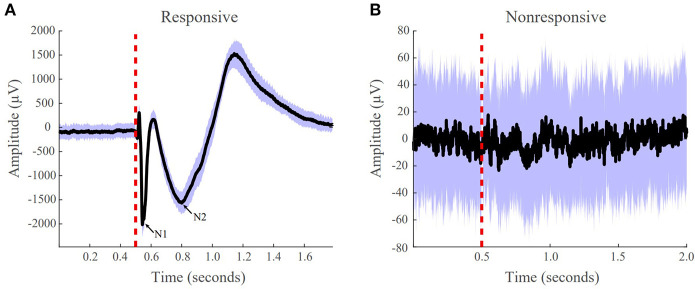
Figure 2.
Examples of responsive and non-responsive waveforms from patient iEEG data. (A) Responsive CCEPs were defined as an absolute value of the post-stimulus amplitude >100 uV from the baseline. The N1 and N2 peak are labeled. (B) Non-responsive CCEP that does not meet the 100 uV post-stimulus amplitude threshold. The black line indicates the average evoked response, the purple boundaries denote one standard deviation, and the red vertical dotted line indicates the stimulation onset.

