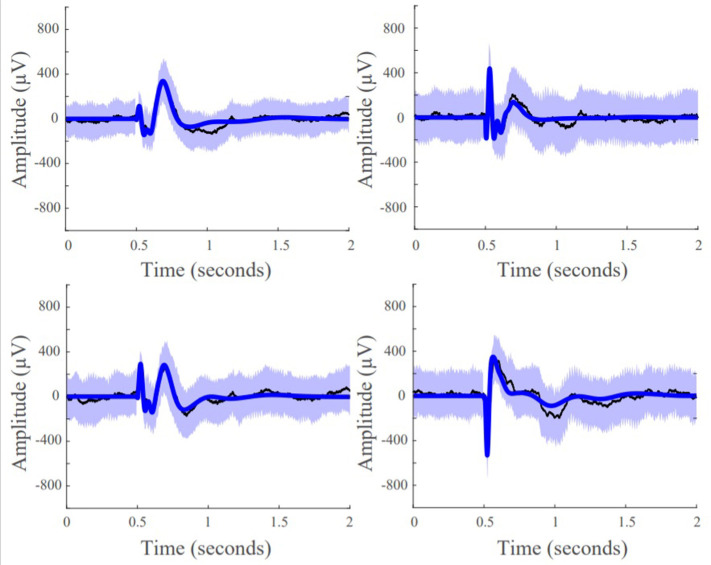
Figure 5.
Model fits of four representative responsive channels from patient data showing SIMO transfer function models capture CCEP responses in recording electrodes. Black lines are the average the evoked responses, blue lines are the model reconstruction, and the purple boundaries denotes one standard deviation.

