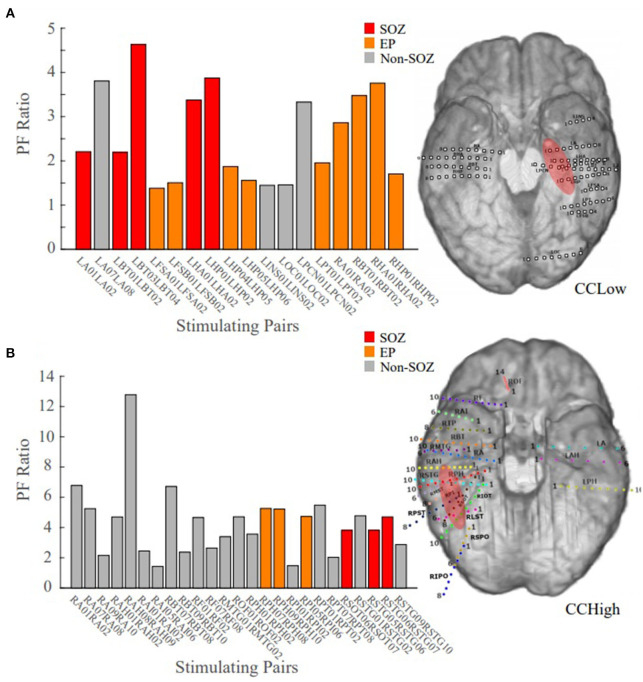
Figure 6.
Bar plot of the PF ratios, where red indicates electrode pairs in the clinically annotated seizure onset zone (SOZ), orange indicates early spread (EP), and gray represents all others. To the right of the bar graphs are the electrode implantation maps for each patient with the clinical annotated SOZ denoted in red. (A) PF ratios of representative “model success” Patient 13 dataset; high PF ratio values closely correspond with SOZ and EP regions. (B) PF ratios of representative “model disagreement” Patient 14A dataset; SOZ and EP PF ratios are indistinguishable from non-epileptogenic regions.

