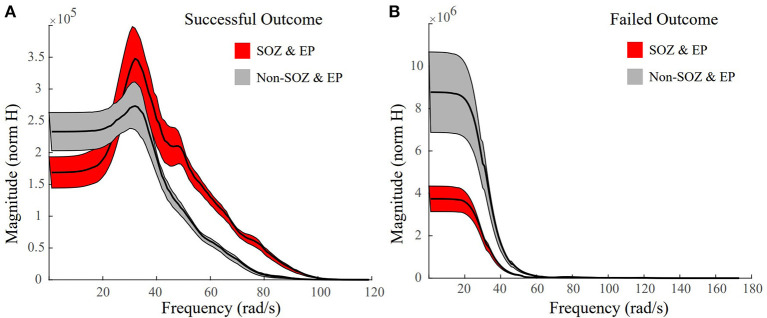
Figure 7.
Representative frequency response plots of a successful and failed surgical outcome where red denotes SOZ and EP stimulated datasets, grey denotes non-SOZ and EP stimulated datasets, black is the mean frequency response, and the shaded regions denote ±2 standard error. (A) Frequency response plot of the SOZ & EP stimulated datasets vs the non-SOZ & EP stimulated datasets for successful surgical outcome Patient 18. The SOZ & EP stimulated datasets show a larger peak gain and a bigger roll off than the non-SOZ & EP counterparts. (B) Frequency response plot of the SOZ & EP stimulated datasets vs the non-SOZ & EP stimulated datasets for failed surgical outcome Patient 2.

