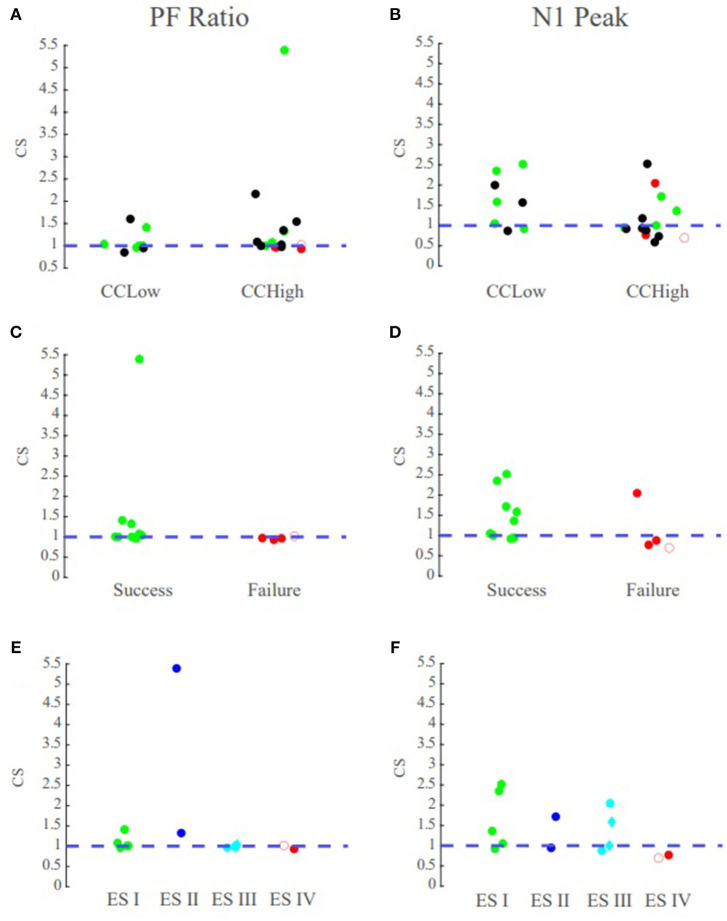
Figure 8.
PF ratio confidence statistic reflects surgical outcome. Green circles denote those patients with successful surgical outcomes, red denotes those with failed surgical outcomes, and black denotes datasets that currently have no surgical outcome. The blue dotted line denotes the boundary for the degree of agreement between clinical annotations and the performance metrics. Diamond shape indicates RNS patients and open circle indicates outlier Patient 5. Top row contains the confidence statistic plots for all datasets. Middle row are the confidence statistic plots for surgical patients categorized by surgical success and failures. Bottom row has the confidence statistic plots for surgical patients categorized by Engel Score. (A) The confidence statistic plot for the PF ratio for all datasets. CCLow patients often have CS > 1, and surgical success nearly always have CS values >1. (B) The confidence statistic plot for N1 peak for all datasets. Less distinction is provided between groups according to the N1 amplitude as compared to system gain. (C,D) Confidence statistic plots for surgical patients categorized by surgical success/failure for (C) PF ratio (D) and N1 peak. (E,F) Confidence statistic plot for surgical patients categorized by Engel score for (E) PF ratio and (F) N1 peak.

