
Figure 1.
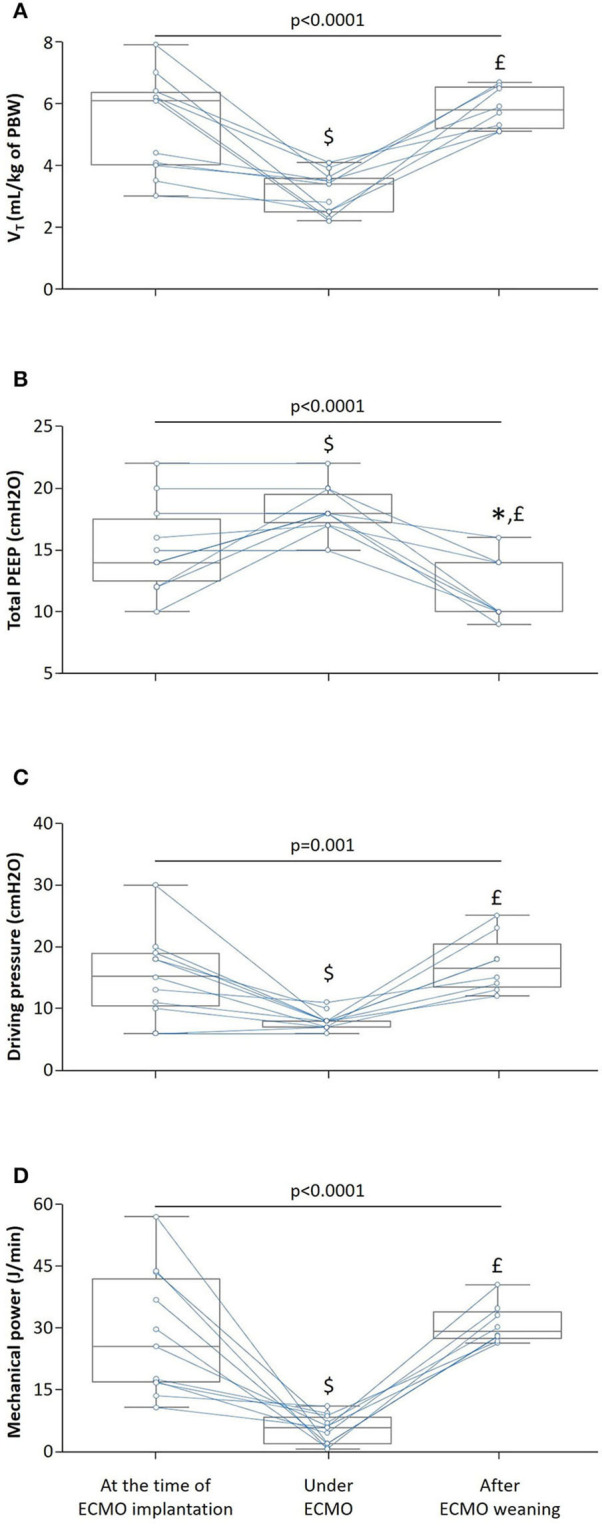
Effects of venovenous extracorporeal membrane oxygenation (ECMO) on mechanical ventilation. The box show the 25th and 75th percentiles, the line in the box the median and the whiskers the minimum and maximum values. Blue lines indicate individual changes. n = 11, p-value for Friedman test, *p < 0.05 after ECMO weaning vs. at the time of ECMO implantation, £p < 0.05 after ECMO weaning vs. under ECMO and $p < 0.05 under ECMO vs. at the time of ECMO implantation. (A) Tidal volume (VT). (B) Total positive end-expiratory pressure (PEEP). (C) Driving pressure. (D) Mechanical power. PBW, predicted body weight.