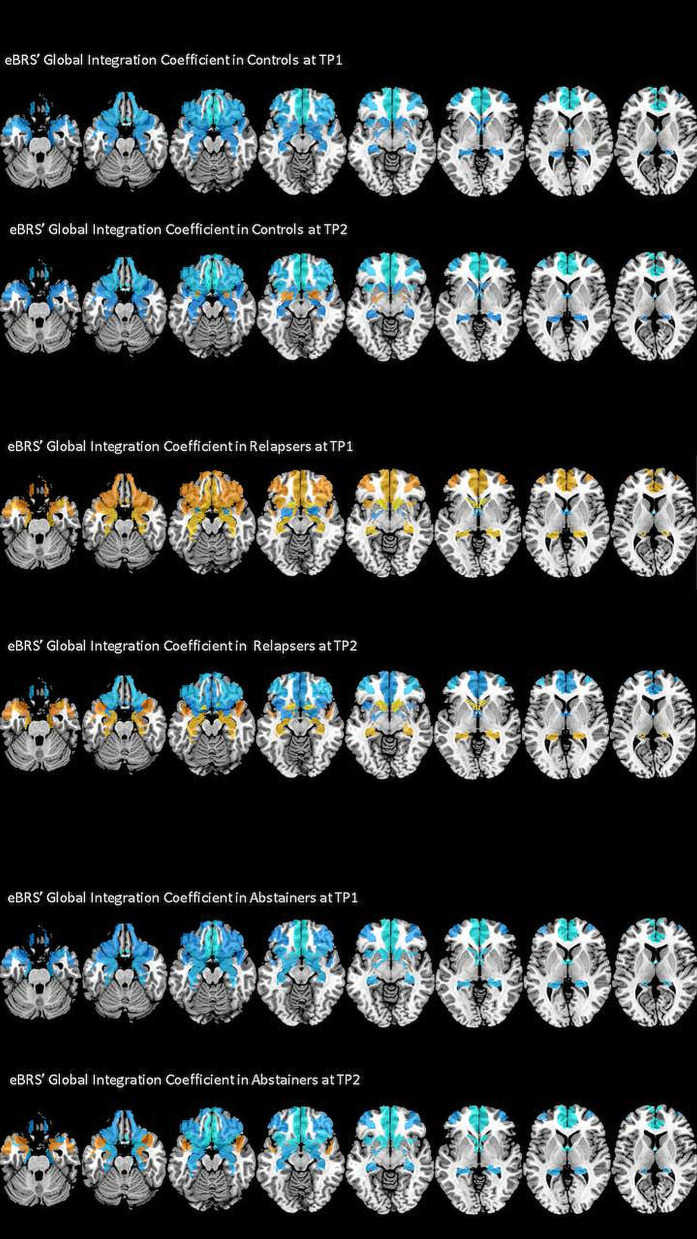
Figure 3.
The degree of global integration of the nine eBRS regions at 1 month into abstinence ad 3 months later. eBRS regions with a positive GIC value are coded in orange – yellow (range 0–0.05) and eBRS regions with a negative GIC value are coded in blue – light blue (range 0–0.1). When compared with the controls and abstainers, relapsers showed over-integration (= positive GIC values) in almost all eBRS regions, while the eBRS in the two other groups was mostly disconnected (= negative GIC values) from the global across-community interaction.

