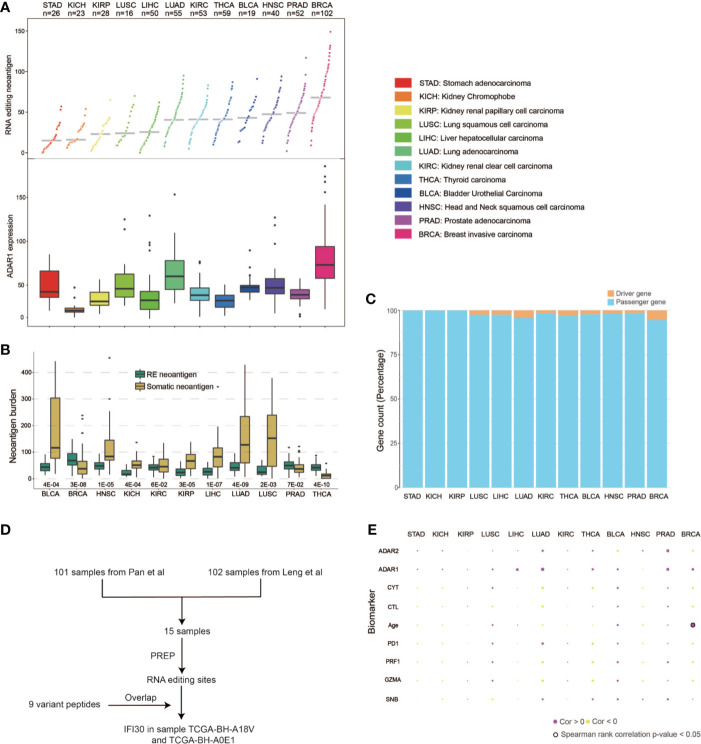
Figure 2.
Pan-cancer RE neoantigen profile analysis of TCGA cohorts. (A) RE neoantigen distribution and expression of ADAR1 in 12 cancer types. (B) RE neoantigen and somatic neoantigen comparison of 12 cancer types. (C) Driver gene distribution of neoantigen in each cancer type. (D) Flowchart of how IFI30 was confirmed expressed and presented. (E) Correlations between RE neoantigen burden and somatic neoantigen burden, expression of CD8A/GZMA/PDCD1/ADAR1/ADAR2 and clinical covariates in 12 cancer types.

