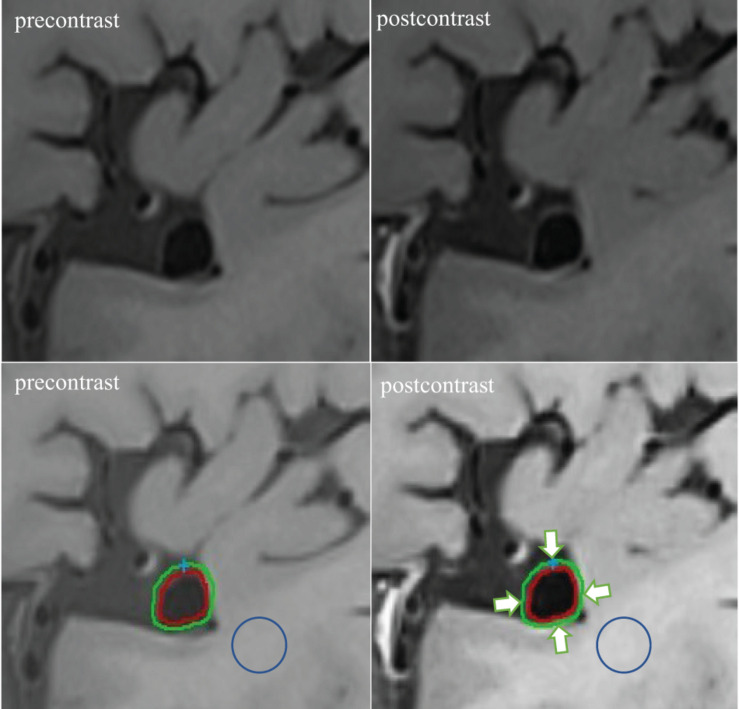
FIGURE 2.
Example of WEI measurement. The post-contrast vessel wall imaging and matched pre-contrast imaging are depicted (upper right and upper left). The software automatically segmented the inner and outer wall contours of the aneurysm in the post-contrast and corresponding pre-contrast imaging (lower right and lower left). Subsequently, all contours in each layer of an aneurysm were automatically segmented into four quarters (arrows indicated). Similar methods were used to measure the average SI of regions of interest on the adjacent white matter on the pre- (circle: lower left) and post-contrast (circle: lower right) vessel wall imaging.

