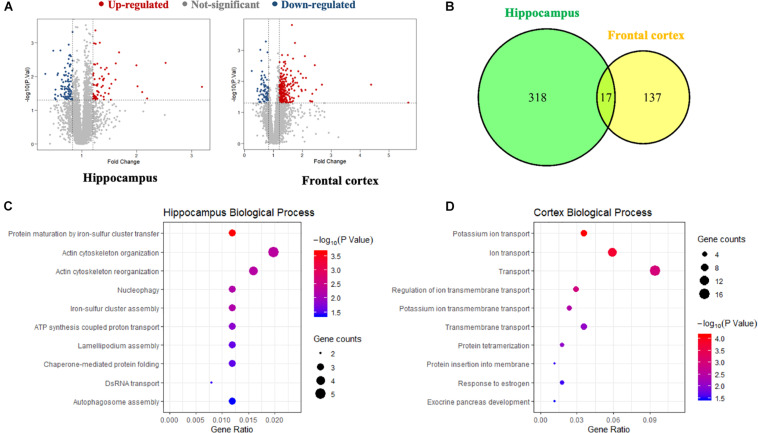
FIGURE 2.
The proteomics analysis of differentially expressed proteins in the hippocampus and frontal cortex samples. (A) Volcano plot of differentially expressed proteins in the hippocampus and frontal cortex after BPN14770 treatment (n = 8). Fold change >1.2 or <0.83, and P < 0.05 as the cut off values for differential protein quantification. (B) Venn diagram of hippocampus and frontal cortex differentially expressed proteins. (C) The biological processes of gene ontology (GO) enrichment analysis of the differentially expressed proteins in the hippocampus. (D) The biological processes of GO enrichment analysis of the differentially expressed proteins in the cortex.

